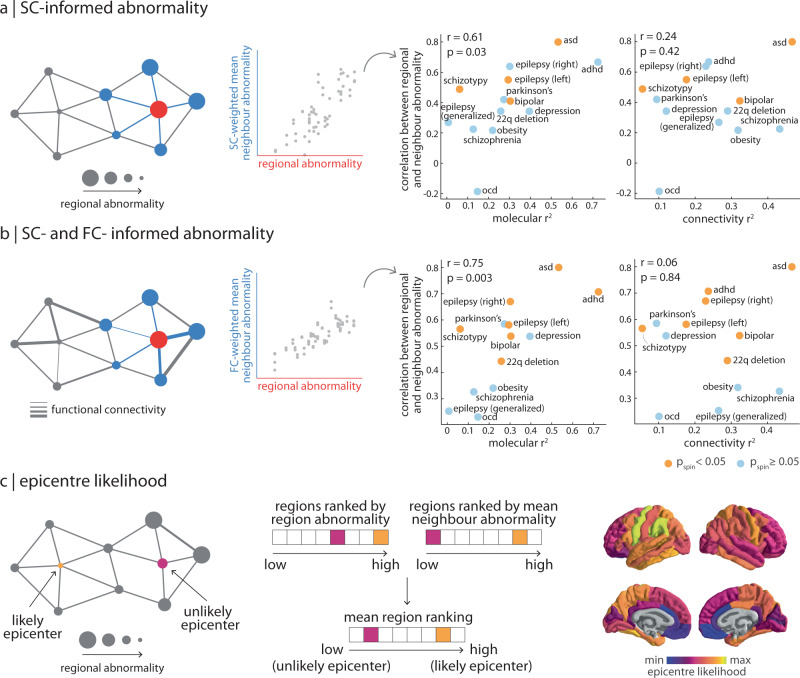
Fig. 4. Interactions between molecular and connectomic vulnerability.
a Left: schematic of structural connectivity informing disorder-related cortical changes. The correlation between SC-weighted mean neighbour abnormality and region abnormality represents the extent to which a disorder demonstrates network-spreading disorder-specific cortical morphology. Right: this correlation coefficient was then correlated (Pearson’s r, two-sided) to both local molecular (left) and global connectivity (right) . Yellow points refer to disorders where the correlation between region abnormality and SC-weighted mean neighbour abnormality is significant (pspin < 0.05). b Left: likewise, mean neighbour abnormality can be additionally weighted by functional connectivity between regions. Right: correlation (Pearson’s r, two-sided) between the extent to which a disorder demonstrates SC- and FC-informed network-spreading cortical morphology and local molecular (left) and global connectivity (right) . Yellow points refer to disorders where the correlation between region abnormality and SC- and FC-weighted mean neighbour abnormality is significant (pspin < 0.05). c Left: a region with high abnormality that is also connected to regions with high abnormality is considered a likely disorder epicentre. Middle: epicentre likelihood was calculated as the mean rank of region and neighbour abnormality (see Supplementary Fig. 7 for individual epicentre likelihoods). Right: median epicentre likelihood was calculated for the disorders that show a significant correlation between regional and neighbour abnormality. To limit biasing cross-disorder epicentre likelihood towards epilepsy epicentre likelihood, left and right temporal lobe epilepsy epicentre likelihood was merged into a single mean epicentre likelihood map, prior to calculating the median. For completeness, Supplementary Fig. 8 shows cross-disorder epicentre likelihood when calculated using alternative statistics.

