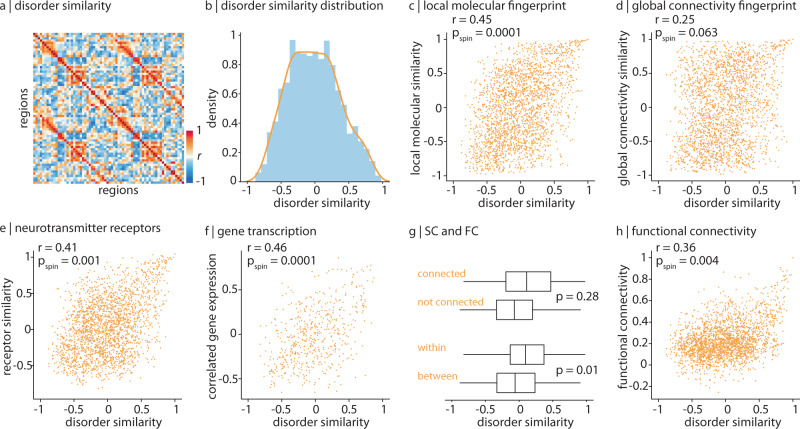
Fig. 5. Brain regions with similar molecular annotations are similarly affected across disorders.
a Disorder similarity was computed as the pairwise correlation of regional cortical abnormality across all thirteen disorders such that pairs of regions with high disorder similarity are similarly affected across disorders. b A histogram depicting the upper triangle of the disorder similarity matrix. c Disorder similarity is significantly correlated to molecular attribute similarity (Pearson's r(2276) = 0.45, pspin = 0.0001, CI = [0.42, 0.49], two-tailed). d Disorder similarity is not significantly correlated with connectomic similarity (Pearson's r(2276) = 0.25, pspin = 0.063, CI = [0.21, 0.29], two-tailed). e Disorder similarity is significantly correlated to neurotransmitter receptor similarity (Pearson's r(2276) = 0.41, pspin = 0.001, CI = [0.38, 0.45], two-tailed). f Left hemisphere disorder similarity is significantly correlated to correlated gene expression (Pearson's r(559) = 0.46, pspin = 0.0001, CI = [0.40, 0.53], two-tailed). g Disorder similarity is significantly greater within intrinsic functional networks than between networks, against the spin-test (p = 0.01; bottom). Disorder similarity is non-significantly greater between structurally connected regions than regions that are not connected, against a degree- and edge-length-preserving null model (p = 0.028101). Bounds of the box represent the 1st (25%) and 3rd (75%) quartiles, the centre line represents the median, and whiskers represent the minima and maxima of the distribution. Nconnected = 592 edges, Nnotconnected = 1686. Nwithin = 388, Nbetween = 1890. h Disorder similarity is significantly correlated to functional connectivity (Pearson's r(2276) = 0.36, pspin = 0.004, CI = [0.33, 0.40], two-tailed).

