Figure 5.
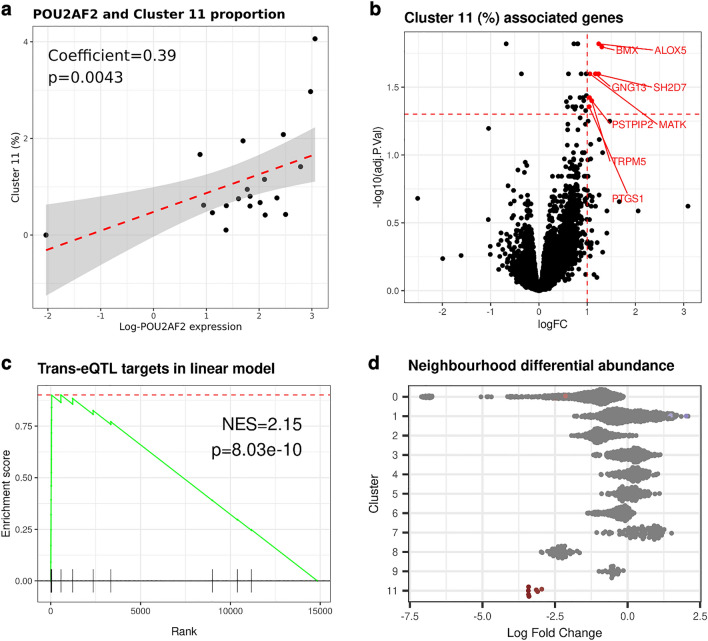
11q23.1 trans-eQTL target expression is associated with the abundance of tuft cell-like cluster. (a) Linear modelling of pseudo-bulked POU2AF2 expression and cluster 11 abundance. (b) Volcano plot of linear model result on pseudo-bulked expression of all 14,843 genes. Significantly associated 11q23.1 trans-eQTLs (logFC > 1, FDR < 0.05) highlighted. (c) GSEA of 11q23.1 trans-eQTLs (FDR < 0.05) in (b), ranked by logFC. (d) Differential abundance of neighbourhoods in the ‘Low’ blue hub gene group compared to ‘High’. Neighbourhoods were identified using miloR26 and grouped by cluster. Only neighbourhoods with major cluster proportion > 0.8 are plotted and only significant neighbourhoods (Spatial FDR < 0.01) are coloured by their logFC (red = down, blue = up). No neighbourhoods from cluster 10 were comprised of major proportion > 0.8.

