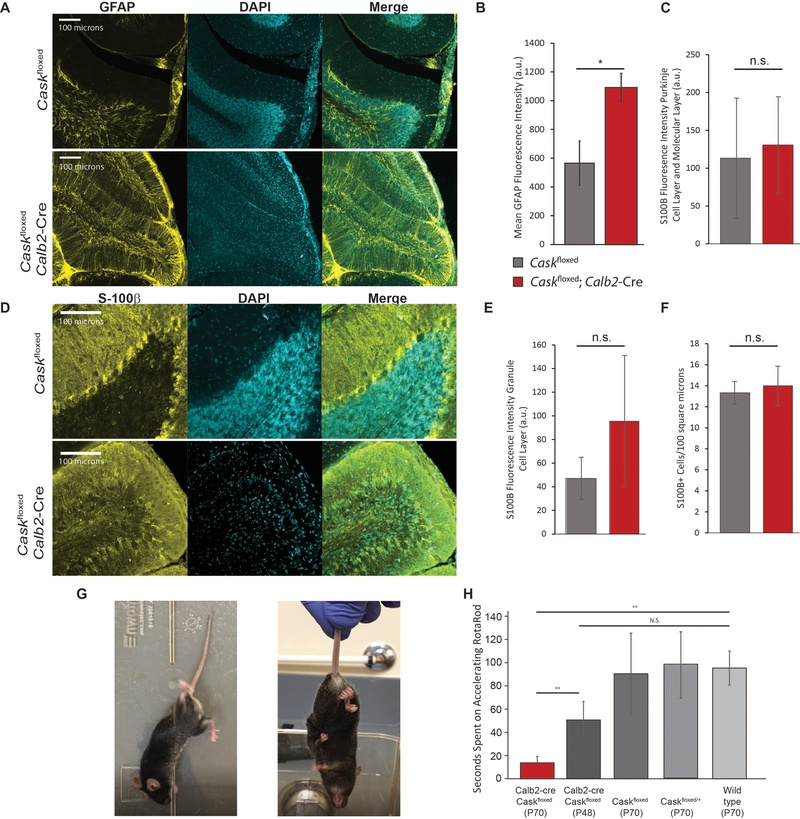
Figure 5. Reactive astrogliosis and locomotor incoordination resulting from cerebellar degeneration caused by CASK loss.
(A) Representative images of GFAP immunostaining of anterior cerebellar folia in Caskfloxed;Calb2-Cre post-ataxia plateau and age-matched Caskfloxed controls; from left to right: GFAP, DAPI, merge. (B) Quantification of fluorescence intensity of GFAP staining by genotype; asterisk indicates p<0.05, n=3 mice of each genotype. (C-E) Representative images and quantification of S100β immunostaining in Caskfloxed; Calb-Cre compared to Caskfloxed controls. Fluorescence intensity was measured for the Purkinje cell layer and molecular layer (C) and the granule cell layer (E) separately due to the unique anatomical distribution of Bergmann glia. (F) Quantification of S100β+ cells in each genotype represented in (D). N=3 mice for each experiment; n.s. indicates p>0.05. (G) Example of aberrant locomotor behavior at rest (left) and hindlimb-clasping behavior in a Caskfloxed;Calb2-Cre mouse (right). (H) Time spent on an accelerating rotarod in seconds by genotype from left to right: Caskfloxed;Calb2-Cre post-ataxia onset (n=4); Caskfloxed;Calb2-Cre pre-ataxia onset (n=5); age-matched Caskfloxed controls (n=4); age-matched heterozygous Caskfloxed/+ controls (n=3); and age-matched wild-type controls (n=4). * indicates p < 0.05 using a two-tailed Student’s t-test. Results are plotted as mean±SEM for all panels.

