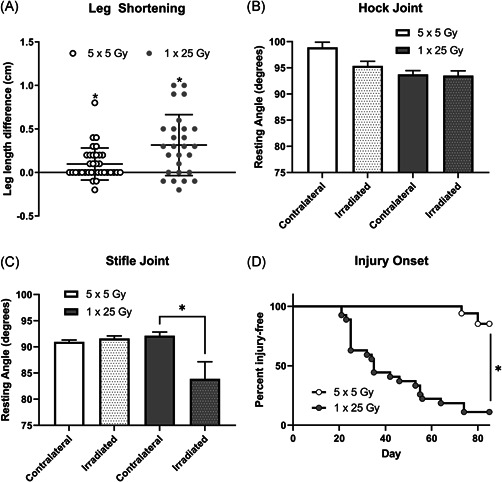
Figure 1.

Irradiated legs were significantly shorter than the contralateral leg in both the fractionated and single‐dose groups. The length of the irradiated leg was subtracted from the length of the contralateral to determine how much shortening had occurred (A). n = 35 (5 × 5 Gy), n = 27 (1 × 25 Gy). *p < 0.05, t test column statistics of mean compared to theoretical mean of 0. Resting angles were measured post‐sacrifice and graphed by radiation dose in the hock (B) or stifle joints (C). Dotted bars indicate irradiated legs, clear bars indicate contralateral legs. n = 35 (5 × 5), n = 27 (1 × 25) *p < 0.05, paired t test. Percent injury‐free survival is shown between the single and fractionated groups (D). n = 35 (5 × 5), n = 27 (1 × 25) *p < 0.0001 log‐rank (Mantel–Cox)
