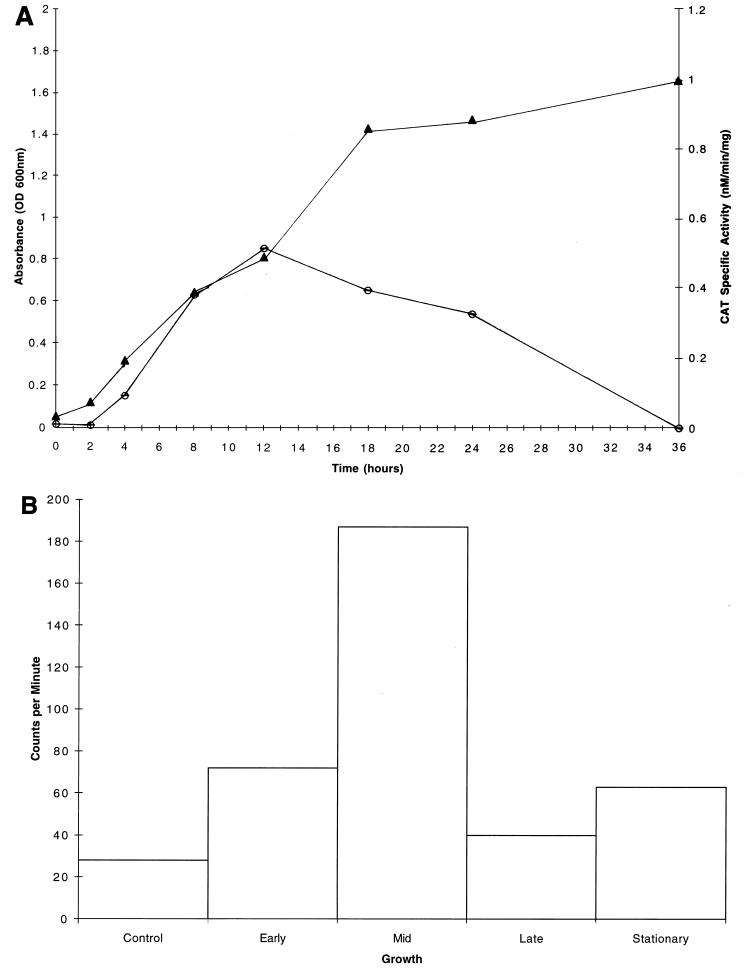
FIG. 6.
(A) Growth curve (closed triangles) and CAT specific activities (open circles) for S. mutans GMS100 cultures grown in CDM supplemented with 1% sucrose. For each CAT specific activity data point, representing the mean of values from three independent experiments, the standard deviation was negligible. (B) Total RNA (1 μg) isolated from S. mutans UA130 grown to early, mid-, or late logarithmic phase or to stationary phase in CDM supplemented with 1% sucrose was dot blotted onto a nitrocellulose membrane and probed with a DNA fragment which is internal to dlt1. Individual dots were excised, and the radioactivity was counted in a Packard Tri-Carb model 1900CA liquid scintillation analyzer. A dot representing nonspecific hybridization was included as a control. Shown are the results of a single representative experiment. Note the maximal expression of dlt during mid-logarithmic phase.

