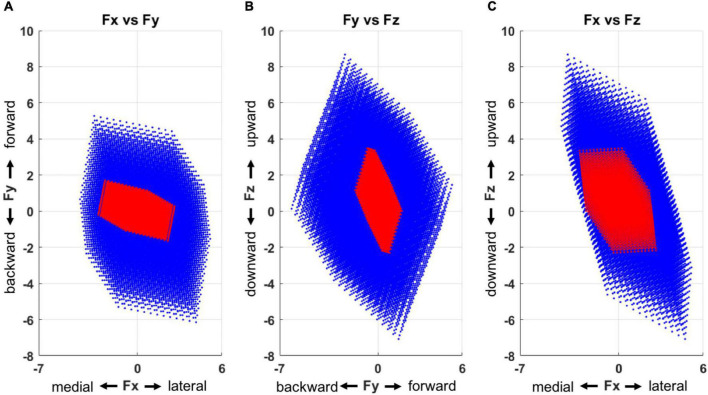
FIGURE 7.
Force space representation for each group (blue: control, red: stroke), presented in three 2-dimensional force spaces (A, Fx vs. Fy; B, Fy vs. Fz; and C, Fx vs. Fz). Compared to the control group, the motor modules of the stroke group represented a smaller force space with a skewed directionality. The force space of the stroke group had a limited size of force sub-space in a combination of lateral, forward, and upward directions as well as medial, backward, and downward ones.

