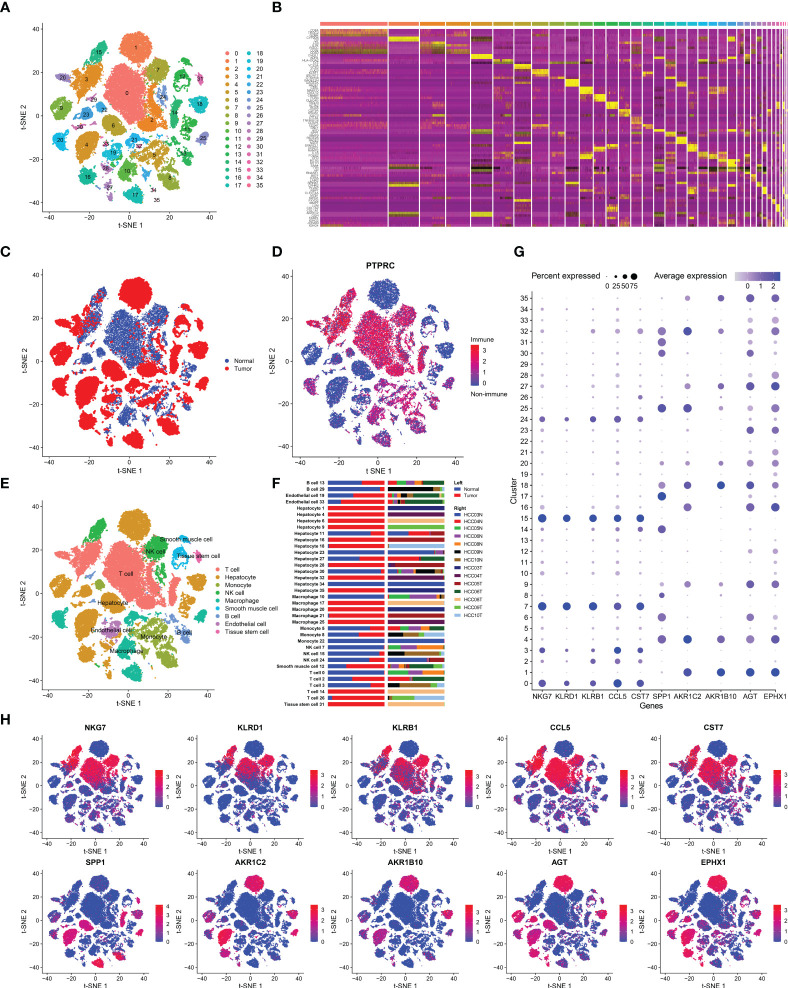
Figure 1.
Cell-type classification in HCC. (A) t-SNE plot of 36 cell clusters. (B) Heatmap of the top five marker genes in each cell cluster. (C) Cell distribution in tumor and normal tissues. (D) Cell distribution in immune cells (PTPRC+) or nonimmune cells (PTPRC-). (E) t-SNE plot exhibiting the cell types in HCC. The labels were automatically annotated by SingleR. (F) Bar plot of the distribution of all identified cell clusters: the proportion of each cell in tumor and normal samples (left) and in each patient (right). (G) The top five DEGs with the highest expression in tumor and normal tissues. (H) t-SNE plot of the top five DEGs.

