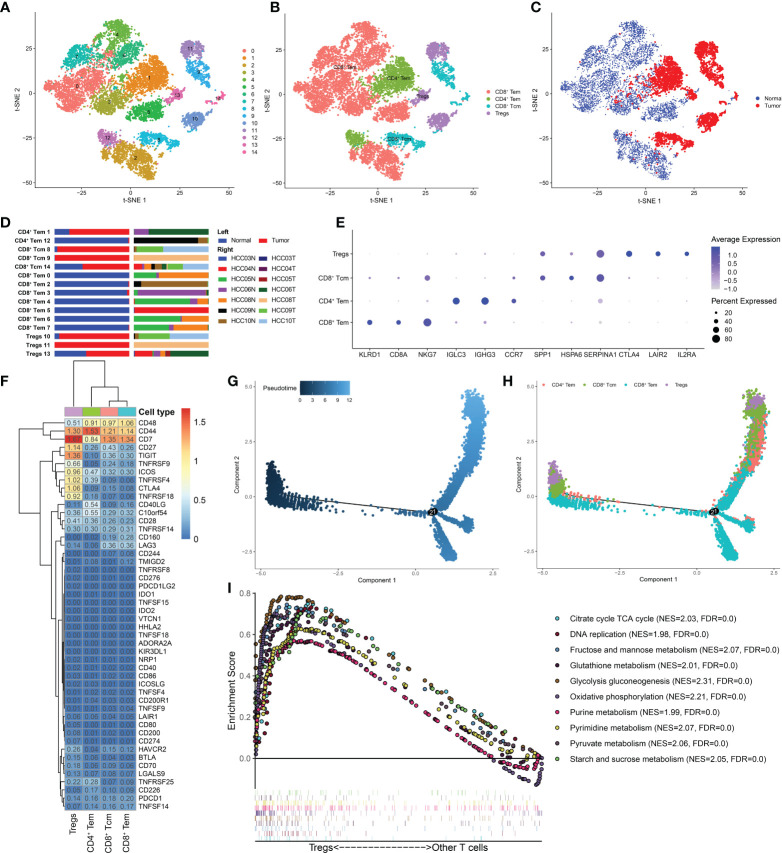
Figure 2.
Treg cells were enriched in HCC and had distinct metabolic characteristics. (A) t-SNE plot of 15 subclusters of T cells and (B) four major T-cell subtypes: CD8+ Tem, CD4+ Tem, CD8+ Tcm, and Treg cells. (C) Distribution of the four T-cell subtypes in tumor and normal samples and (D) in each patient. (E) Top five marker genes of the four T-cell subtypes. (F) Heatmap of immune checkpoint expression in the four T-cell subtypes. The row Z score represents the expression level. A differentiation trajectory of T cells, colored based on pseudotime (G) and cell type (H), is shown. (I) GSEA revealed that metabolic pathways were significantly enriched (FDR < 0.05) in Treg cells.

