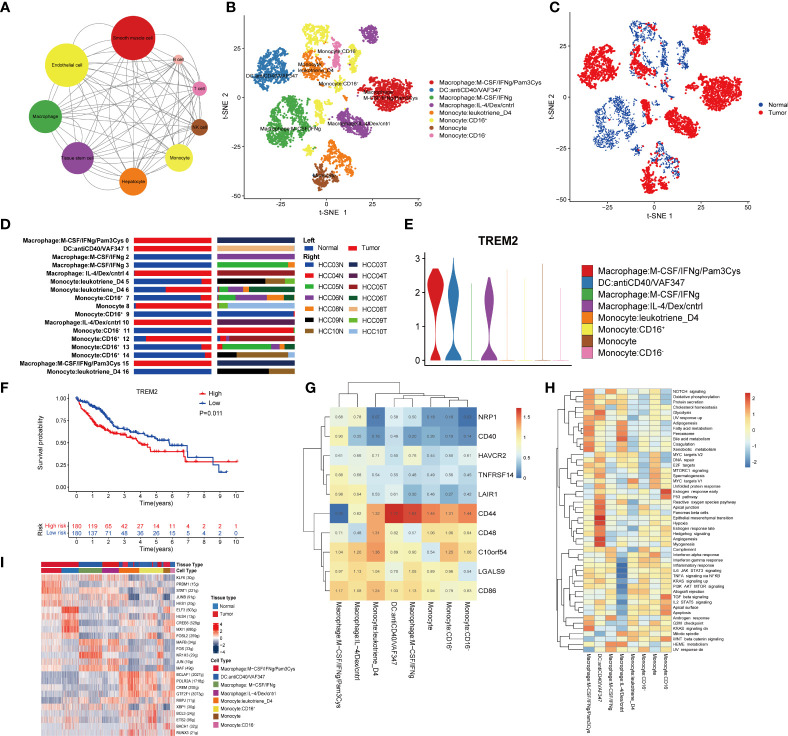
Figure 3.
Macrophages are related to the immunosuppressive environment of the TME. (A) Interaction network constructed by CellPhoneDB. The size of the circles represents the interaction count. A larger size means more interaction with other cell types. (B) t-SNE plot of the eight subtypes of macrophages. (C) Distribution of the eight subtypes of macrophages in tumor and normal samples and (D) in each patient. (E) Violin plots of the expression of TREM2 in the eight subtypes of macrophages. (F) Kaplan–Meier survival curve for patients in the TCGA LIHC cohort. A log rank p value <0.05 was considered statistically significant. (G) Heatmap of immune checkpoint expression in macrophages. The row Z score represents the expression level. (H) Differences in hallmark pathway activities scored with GSVA. The t values calculated by a linear model are shown. (I) Heatmap of the AUC scores of the expression of transcription factors identified by SCENIC.

