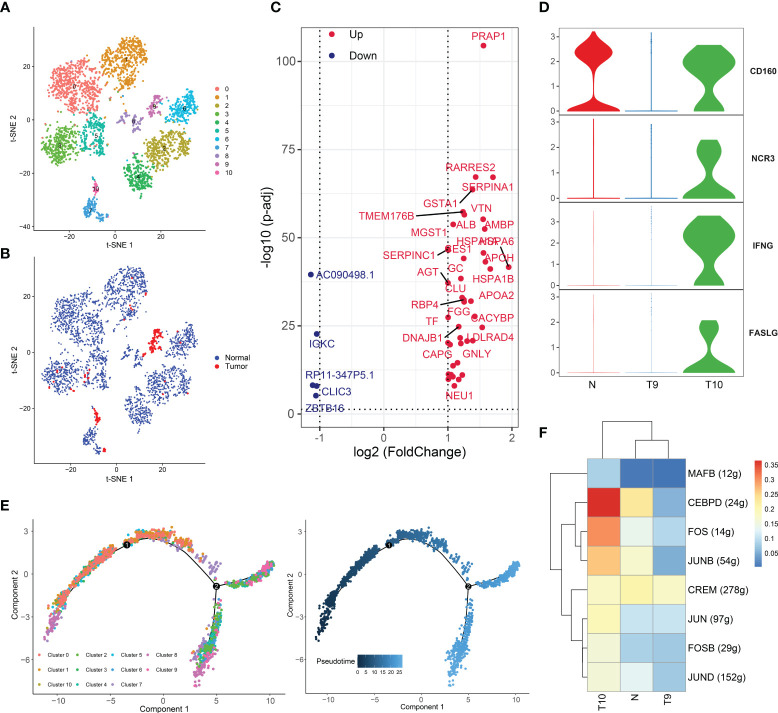
Figure 4.
Two distinct NK-cell subsets with different cytotoxic abilities in HCC. (A) t-SNE plot of the eleven subsets of NK cells. (B) Distribution of the eleven NK-cell subtypes in tumor and normal samples. (C) Volcano plot of the differentially expressed genes (DEGs) between tumor-derived NK cells and normal tissue-derived NK cells. The upregulated genes (log2(fold change) >1) are colored red, while the downregulated genes (log2(fold change) less than -1) are colored blue. Upregulated and downregulated genes are annotated. (D) Violin plots of the expression of several activating receptors, including CD160, NCR3, IFNG (IFNγ) and FASLG, in cluster 9, cluster 10 and normal tissues. (E) Differentiation trajectory of NK cells, colored for pseudotime (right) and cell subset (left). (F) Heatmap of the AUC scores of the expression of transcription factors identified by SCENIC.

