Figure 6.
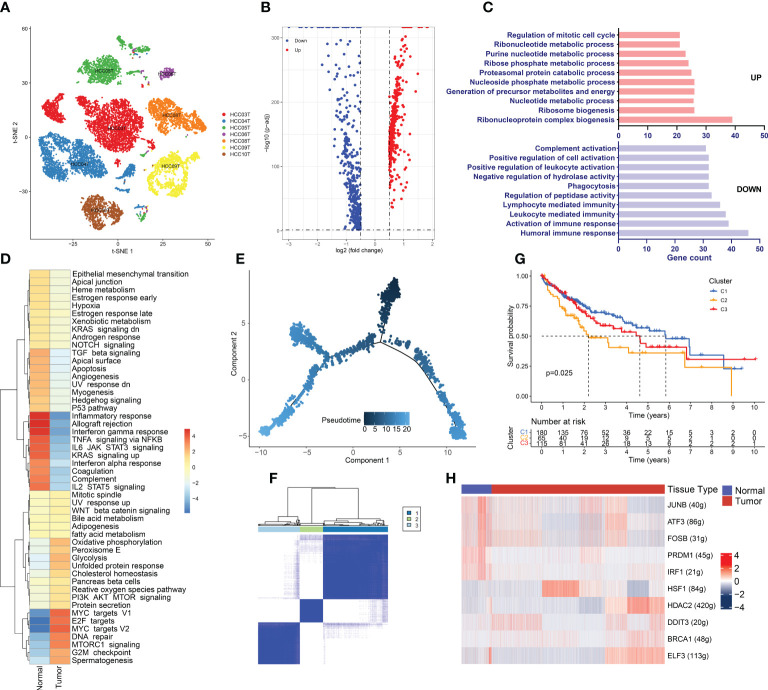
Hypermetabolism and immunosuppression in hepatoma Cells. (A) Cancer cell distribution across all tumor samples. (B) Volcano plot of the DEGs between tumor-derived hepatoma cells and normal tissue-derived hepatocytes. The upregulated genes (log2(fold change) >0.5) are colored red, while the downregulated genes (log2(fold change) less than 0.5) are colored blue. (C) Gene Ontology analysis of the DEGs. The upregulated and downregulated DEGs are annotated. FDR <0.05 was considered significantly enriched. (D) Differences in hallmark pathway activities scored with GSVA. The t values calculated by a linear model are shown. (E) Differentiation trajectory of cancer cells colored for pseudotime. (F) TCGA LIHC patients were clustered into 3 clusters by ConsensusClusterPlus based on the expression of genes related to the cancer cell evolution states. (G) Kaplan–Meier survival curves for the patients in the 3 clusters. A log rank p value < 0.05 was considered statistically significant. (H) Heatmap of the AUC scores of the expression of transcription factors identified by SCENIC.

