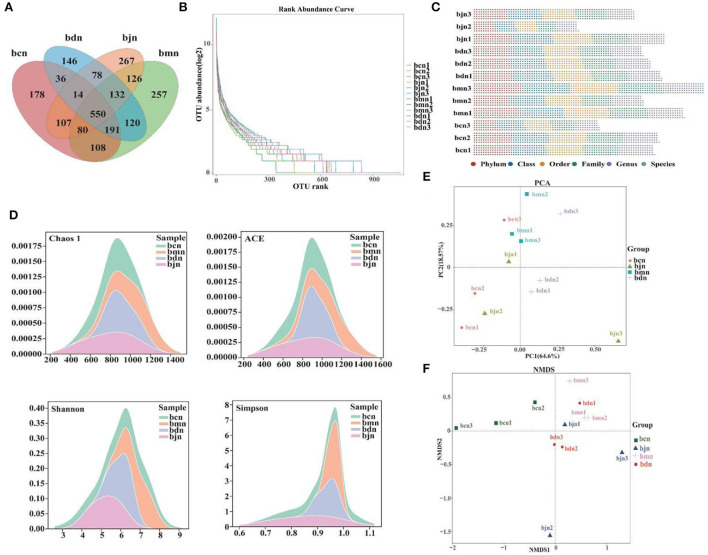
Figure 4.
OTU number and diversity of intestinal contents microbiota. (A) Venn diagram. (B) Rank abundance distribution curve. The longer the folded line, the greater the number of OTUs in the sample. The gentler the curve, the better the uniformity of the community; the steeper the curve, the lower the homogeneity of the community. (D) OTU number of each sample at different classification levels. (C) OTU in each sample at each classification level. (D) Chaos 1 index; ACE index; Shannon index; Simpson index. (E) PCA analysis. (F) NMDS analysis. Data were mean ± SD, n = 3, p > 0.05. bcn: normal saline-treated basal diet group; bmn: normal saline-treated high-fat diet group; bdn: DO traditional decoction-treated high-fat diet group; bjn: lipid-lowering decoction-treated high-fat diet group.

