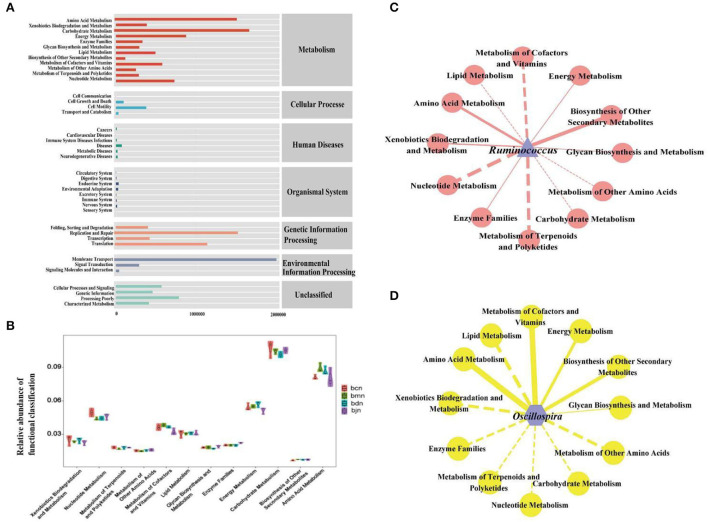
Figure 6.
Functional analysis of intestinal contents microbiota. (A) Predicted abundance of KEGG function. (B) Histogram of metabolic function. (C) Interaction network of “Ruminococcus-metabolic function”. (D) Interaction network of “Oscillospira-metabolic function.” Solid line represented positive correlation, dotted line represented negative correlation. The thickness of the line indicated the strength of the correlation. bcn: normal saline-treated basal diet group; bmn: normal saline-treated high-fat diet group; bdn: DO traditional decoction-treated high-fat diet group; bjn: lipid-lowering decoction-treated high-fat diet group.

