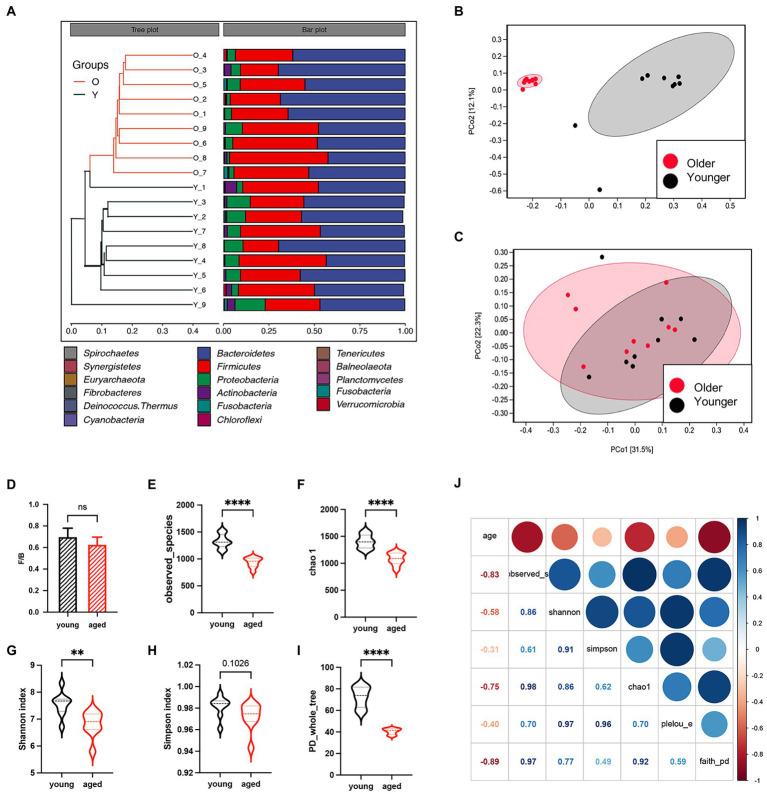
Figure 1.
Gut microbiota between healthy older and younger people. (A) Unweighted pair group method with arithmetic mean clustering of samples shows younger and older groups were separated in the phylogenetic tree. (B) Principal coordinates analysis based on weighted UniFrac metrics. (C) Principal coordinates analysis based on unweighted UniFrac metrics. (D) The Firmicutes/Bacteroidota ratio of the two groups. (E–I) Alpha diversity indicators of the two groups. (J) The heatmap of correlation between alpha diversity and age.

