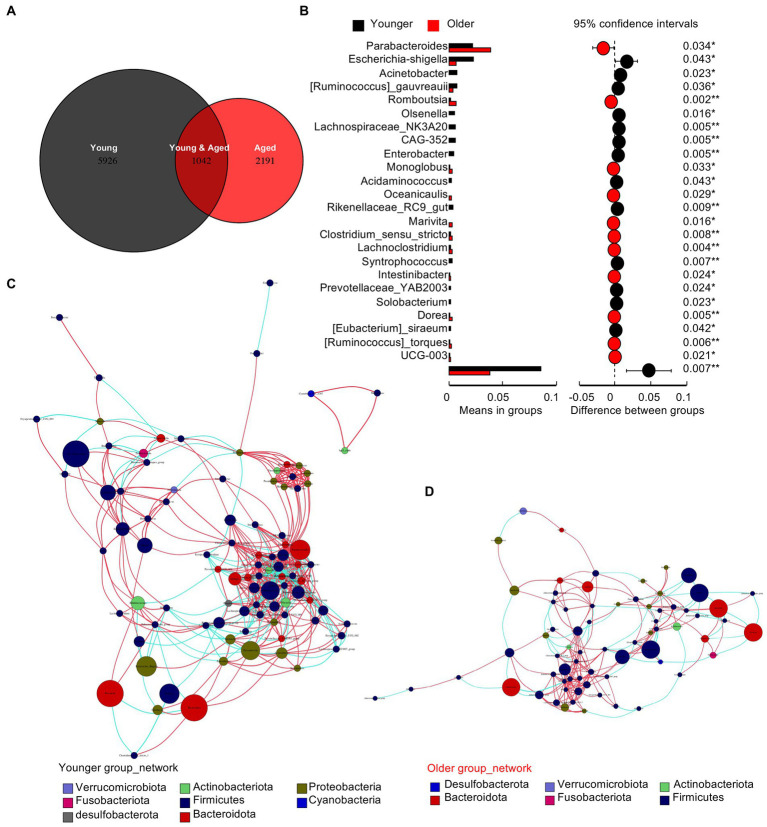
Figure 2.
Gut microbiota of older people show the deletion of multiple types of non-dominant species. (A) Venn diagram of the two groups. (B) The t test between the two groups at the genus level. (C) Co-occurrence network diagrams of the healthy young group. (D) Co-occurrence network diagrams of the healthy older group.

