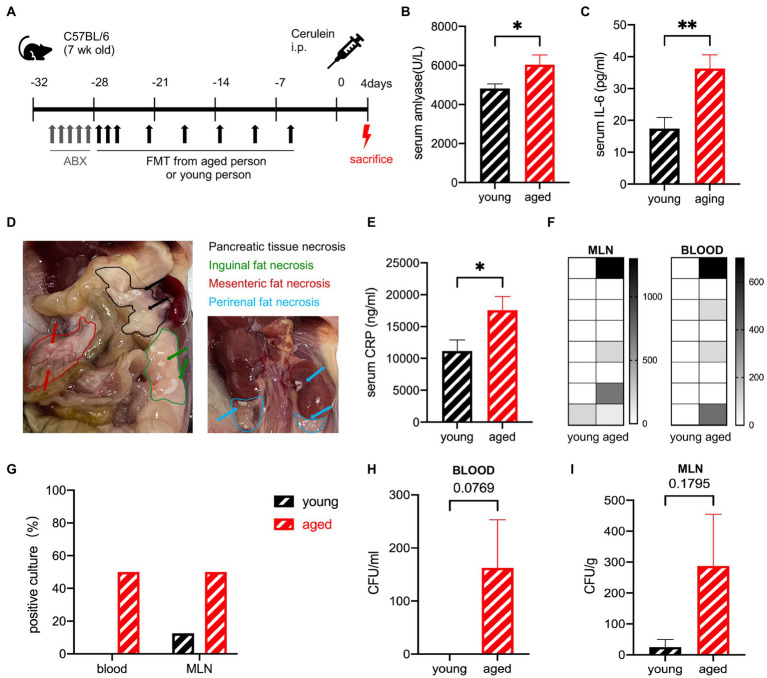
Figure 4.
(A) Mouse model of severe acute pancreatitis. (B) Serum amylase levels are significantly increased in the old group (n = 9) compared to the young group (n = 10). (C) Serum IL-6 levels are significantly increased in the old group (n = 8) compared to the young group (n = 8). (D) Pancreatic and extra pancreatic fat necrosis in mice in the old group on day 4. (E) Serum CRP levels are significantly increased in the old group (n = 8) compared to the young group (n = 8). (F) Heatmap of the CFU(log2) of blood and MLN (n = 8). (G) Frequency of culture positivity in blood and MLN (n = 8 per group). CFU (n = 8 per group) in the blood (H) and MLN (I). *p < 0.05, **p < 0.01, ***p < 0.001, ****p < 0.0001, ns, no significant difference.

