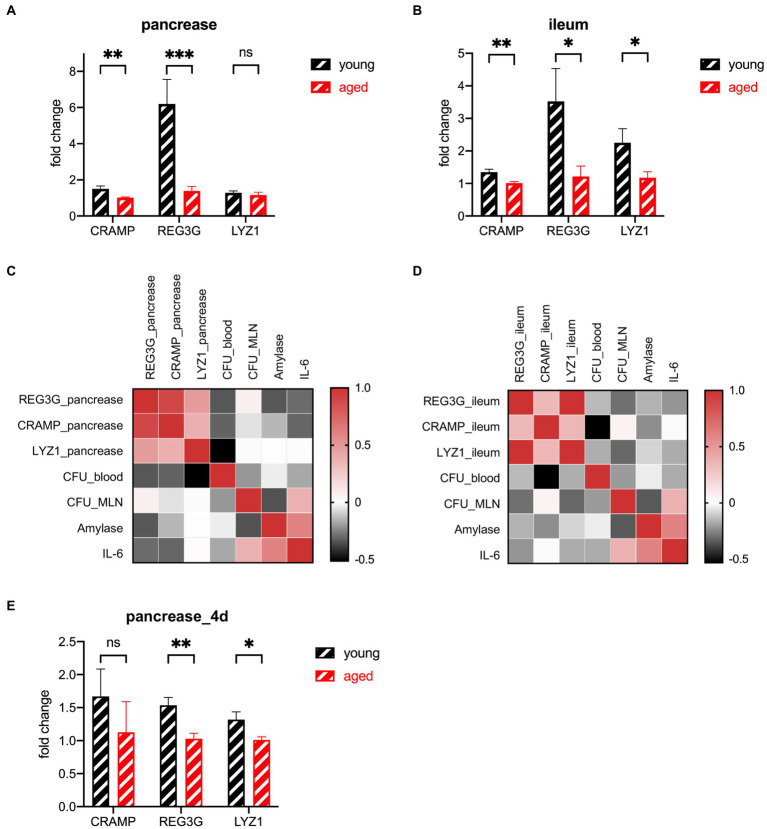
Figure 5.
Expression of AMP genes in the pancreas (A) and ileum (B) of the young group (n = 5) versus the old group (n = 5) at the lethal endpoint of 24 h. (C) Heatmap of the Spearman correlation coefficients between the AMPs of the pancreas and other indicators. (D) Heatmap of the Spearman correlation coefficients between the AMPs of the ileum and other indicators. (E) Expression of AMP genes of the pancreatic tissue of the young group (n = 5) versus the old group (n = 5) at the lethal timepoint of 4 d. *p < 0.05, **p < 0.01, ***p < 0.001, ****p < 0.0001, ns, no significant difference.

