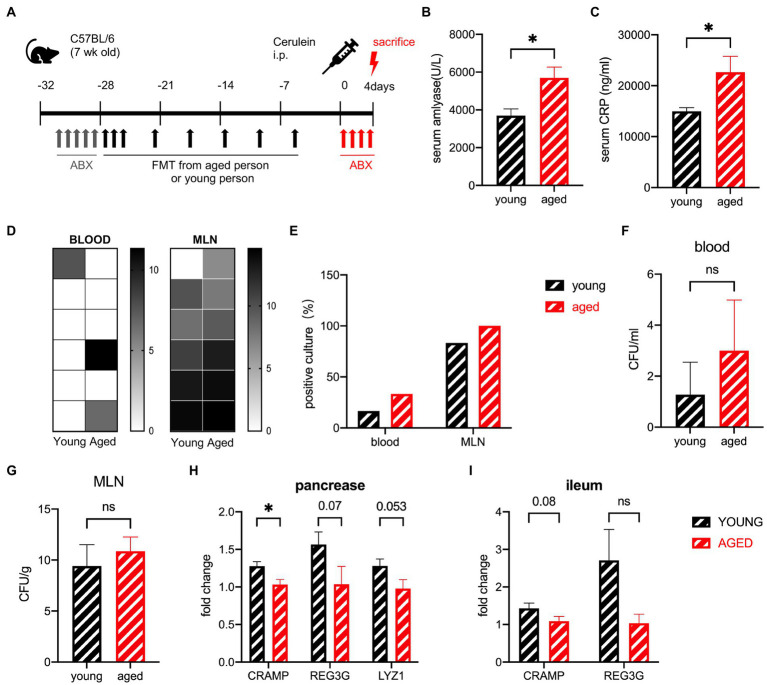
Figure 8.
(A) Experimental design for gut depletion after SAP. (B) Serum amylase levels are significantly increased in the old group compared to the young group. (C) Serum CRP levels are significantly increased in the old group compared to the young group. (D) Heatmap of the CFU (log2) of blood and MLN. (E) Frequency of culture positivity in blood and MLN. CFU in the blood (F) and MLN (G). Expression of AMP genes in the pancreas (H) and ileum (I) of the young group versus the old group (n = 6 per group). *p < 0.05, **p < 0.01, ***p < 0.001, ****p < 0.0001, ns, no significant difference.

