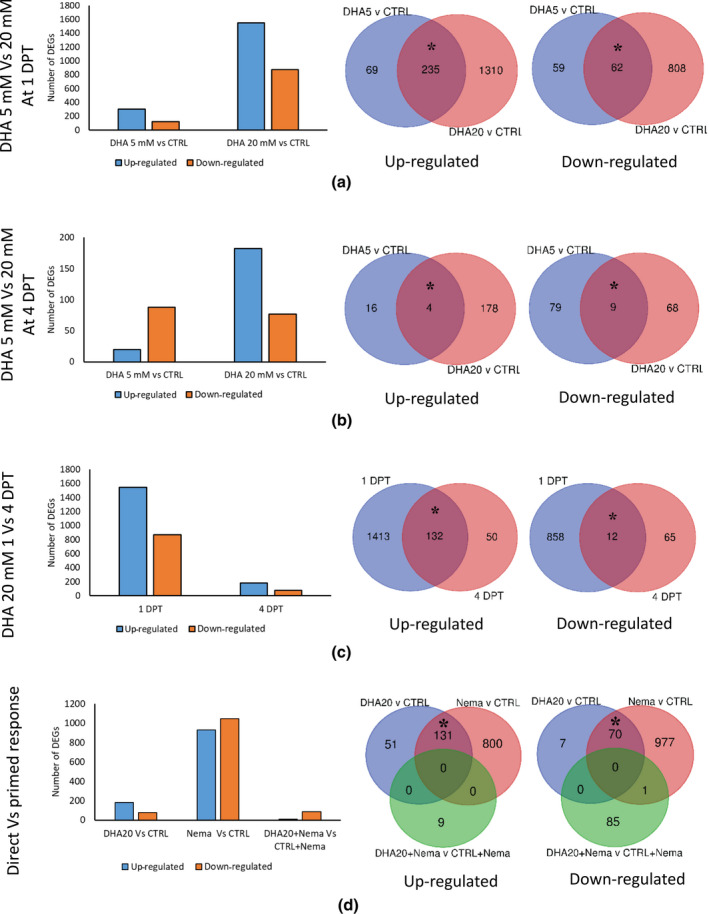
FIGURE 2.

Differentially expressed genes (DEGs) in rice roots after foliar dehydroascorbate (DHA) treatment. Bar chart and Venn diagrams represent the number and overlap between DEGs after DHA treatment at 5 mM (DHA 5 mM vs. control) and 20 mM (DHA 20 mM vs. control) at (a) 1 and (b) 4 days posttreatment (DPT). (c) Number of DEGs after 20 mM DHA treatment (DHA 20 mM vs. control) at 1 and 4 DPT. (d) Number of DEGs after DHA treatment (DHA 20 mM vs. control) and in the nematode‐inoculated vs. control and 20 mM DHA + nematode vs. mock‐treated + nematode groups at 4 DPT/3 days postinoculation. Asterisks in the Venn diagram indicate statistically significant overlap between two gene lists (χ2 test, *p < 0.01).
