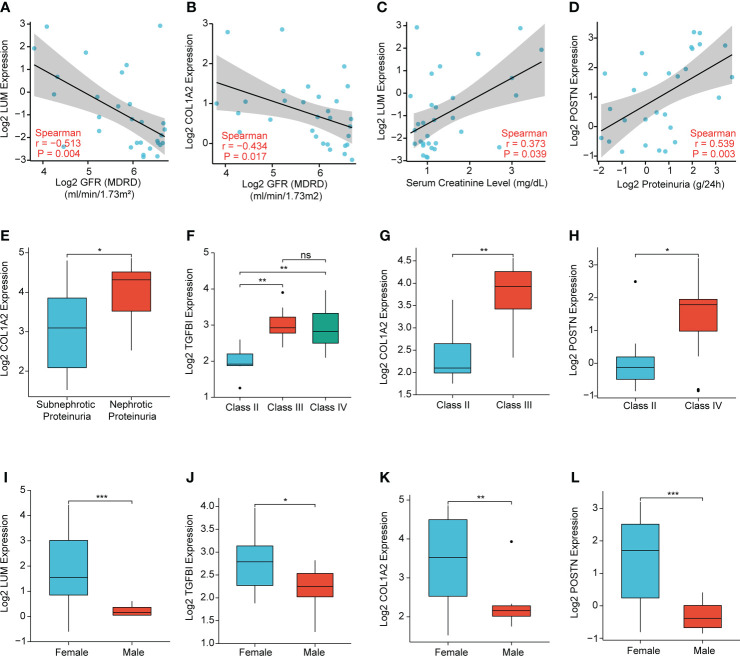
Figure 10.
Correlation analysis of the expression levels of LUM, TGFBI, COL1A2, and POSTN with the clinicopathological features, including (A, B) glomerular filtration rate (GFR), (C) serum creatinine level, (D, E) proteinuria, (F–H) WHO class, and (I-L) sex. (*P < 0.05, **P < 0.01, ***P < 0.001 and ns, no significance).

