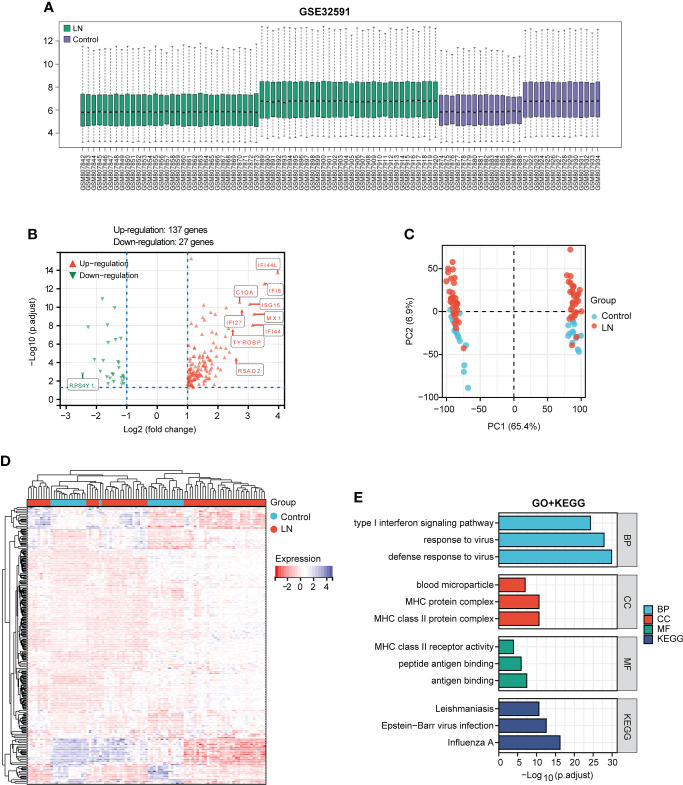
Figure 2.
Identification of DEGs between the LN sample and control groups in the GSE32591 dataset and function enrichment analysis. (A) Box plot displaying gene probe expression levels. (B) Volcano plot of DEGs between LN patients and controls. The top 10 differentially expressed genes are marked on the plot. (C) PCA of the samples. (D) Expression heatmap of all screened DEGs. (E) GO and KEGG enrichment analyses of DEGs.

