Figure 4.

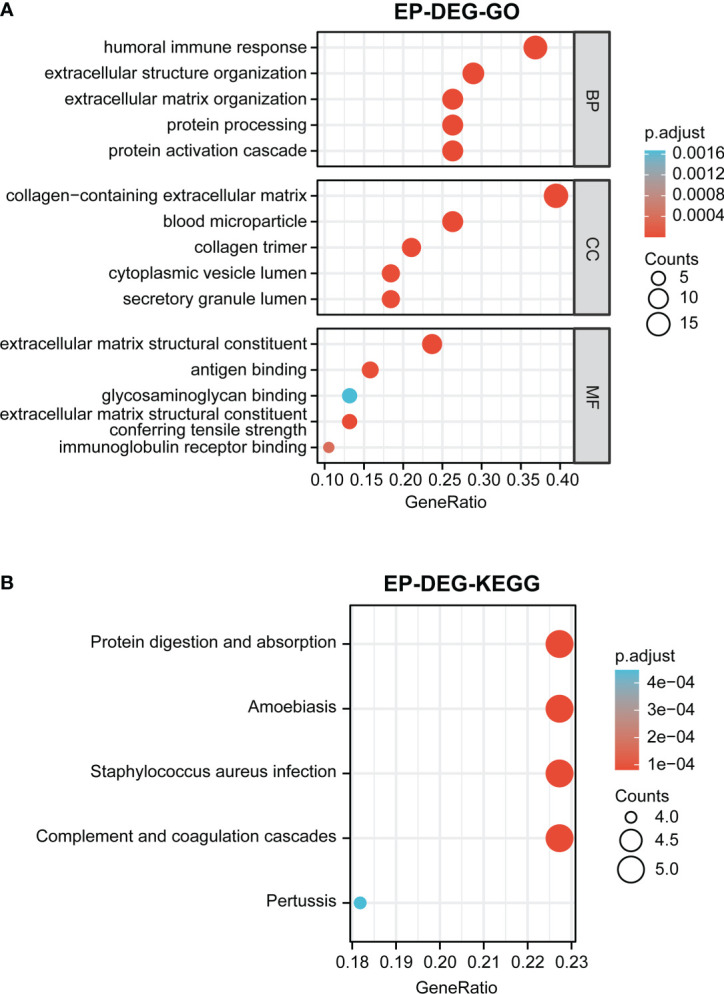
Function enrichment analysis of EP-DEGs. (A) GO enrichment analysis of EP-DEGs in BP, CC, and MF processes (BP, biological process; CC, cellular component; MF, molecular function). (B) KEGG enrichment analysis of EP-DEGs. The size of the circles indicates the number of genes. The larger the circle, the greater the number of genes.
