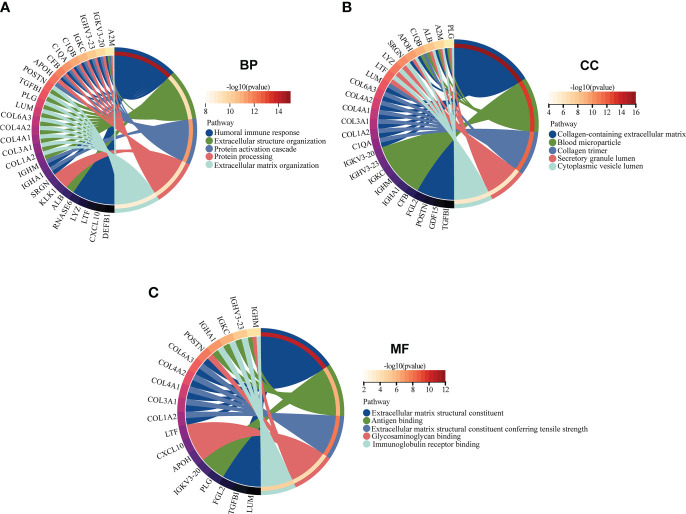
Figure 5.
GO enrichment analysis of EP-DEGs in BP, CC, and MF (BP, biological process; CC, cellular component; MF, molecular function). (A–C) The circle graph showing the top5 pathway of BP, CC, and MF, respectively. Different color represents different pathway, and the differentially expressed genes in the pathway are displayed.

