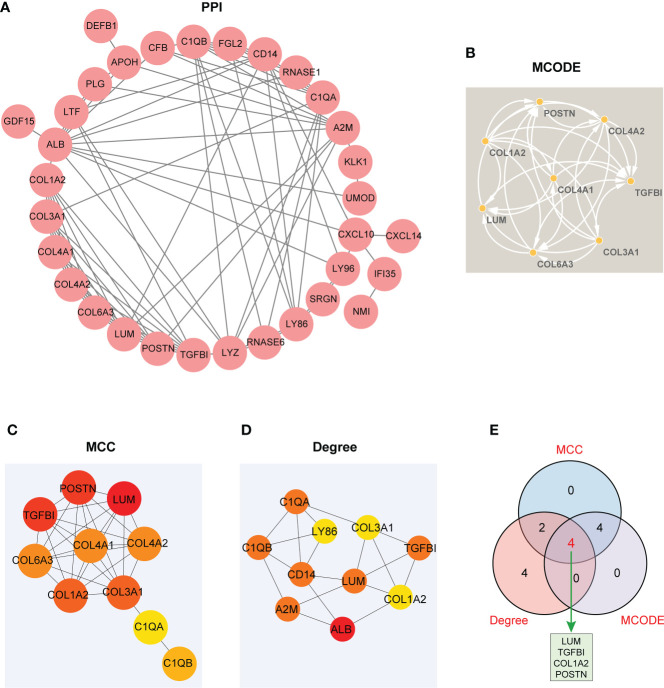
Figure 6.
The visualized PPI network of EP-DEGs for determining the key EP-DEGs. (A) Construction of the PPI network of 38 EP-DEGs via the STRING database. (B) A total of eight candidate genes were identified from EP-DEGs according to the score sorted by the MCODE method using Cytoscape. (C) Top 10 genes were obtained according to the score calculated by the MCC method. (D) Top 10 genes were selected according to the score calculated by the Degree method. (E) Venn diagram displaying four key genes such as LUM, TGFBI, COL1A2, and POSTN acquired by the intersection of the three methods (MCC, Degree, and MCODE). The other genes obtained from the intersection between MCC and Degree methods were C1QB and C1QA. The other genes obtained from the intersection between MCC and MCODE methods were COL3A1, COL6A3, COL4A2, and COL4A1.

