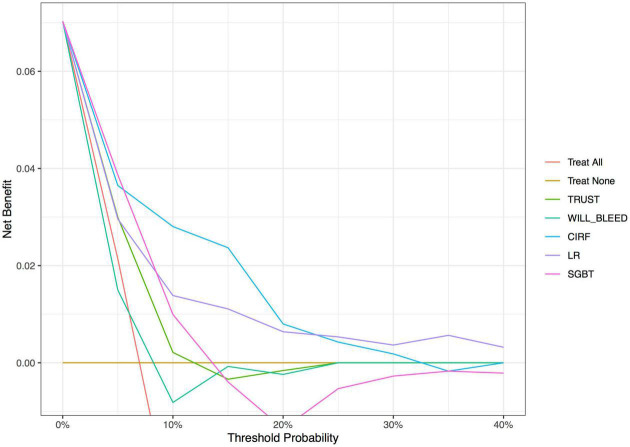
FIGURE 2.
Decision curve analysis of the conventional models and machine learning-based models. The X-axis indicates the threshold probability and Y-axis indicates the net benefit. The red solid line indicates the net benefit of all patients developing postoperative major bleeding events. Ochre’s solid line indicates the net benefit of no patients developing postoperative major bleeding events. LR, logistic regression; CIRF, conditional inference random forest; SGBT, stochastic gradient boosting.

