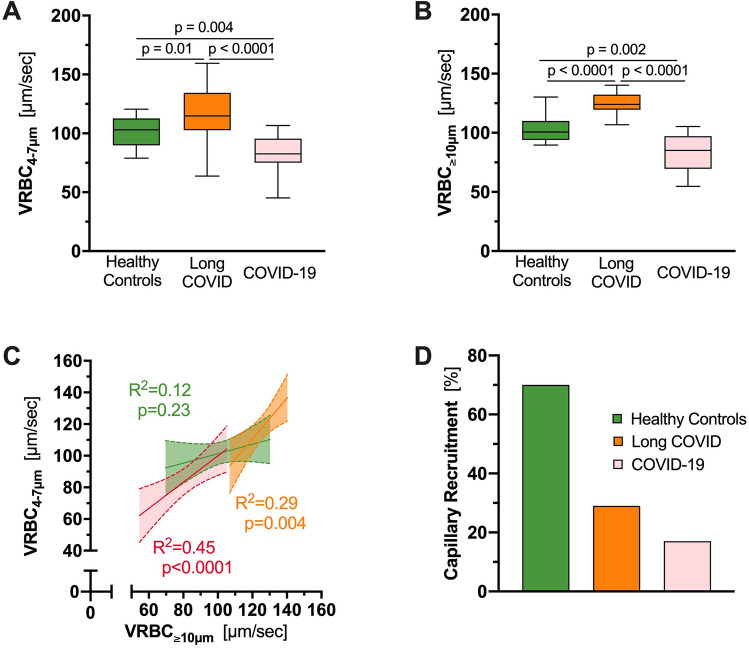
Fig. 2.
Red blood cell velocities and recruitment capacity. A, B Boxplots of A VRBC in capillaries (D ≤ 7 µm) and B VRBC in feed vessels (D ≥ 10 µm) of long COVID individuals (orange), hospitalized COVID-19 patients (pink) and healthy controls (green). C Scatter dot plots and simple linear regression (slope) with 95% confidence intervals of VRBC in capillaries plotted against VRBC in feed vessels of long COVID individuals (orange), hospitalized COVID-19 patients (pink) and healthy controls (green). D Bar charts showing the capillary recruitment (CR), defined as 1 − slope [VRBC (D ≤ 7 µm) vs. VRBC (D ≥ 10 µm)] per group

