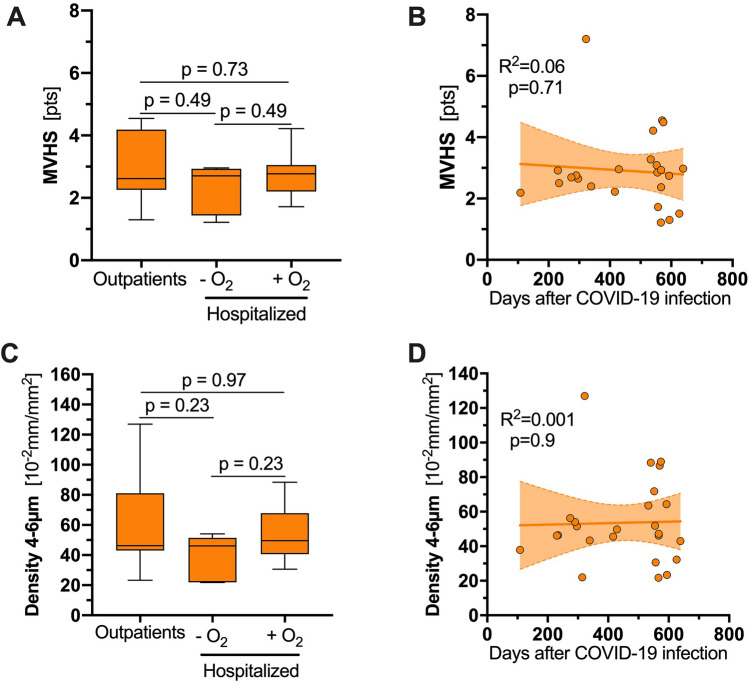
Fig. 3.
Sensitivity analyses in individuals with long COVID. A, C Boxplot of (A) MVHS and (C) density of long COVID individuals based on the clinical course of their acute COVID-19 infection. B, D Scatter dot plots and simple linear regression (slope) with 95% confidence intervals of (B) MVHS and (D) capillary density plotted against the days after the COVID-19 infection. COVID-19 Coronavirus disease 2019, MVHS microvascular health score, ns not significant

