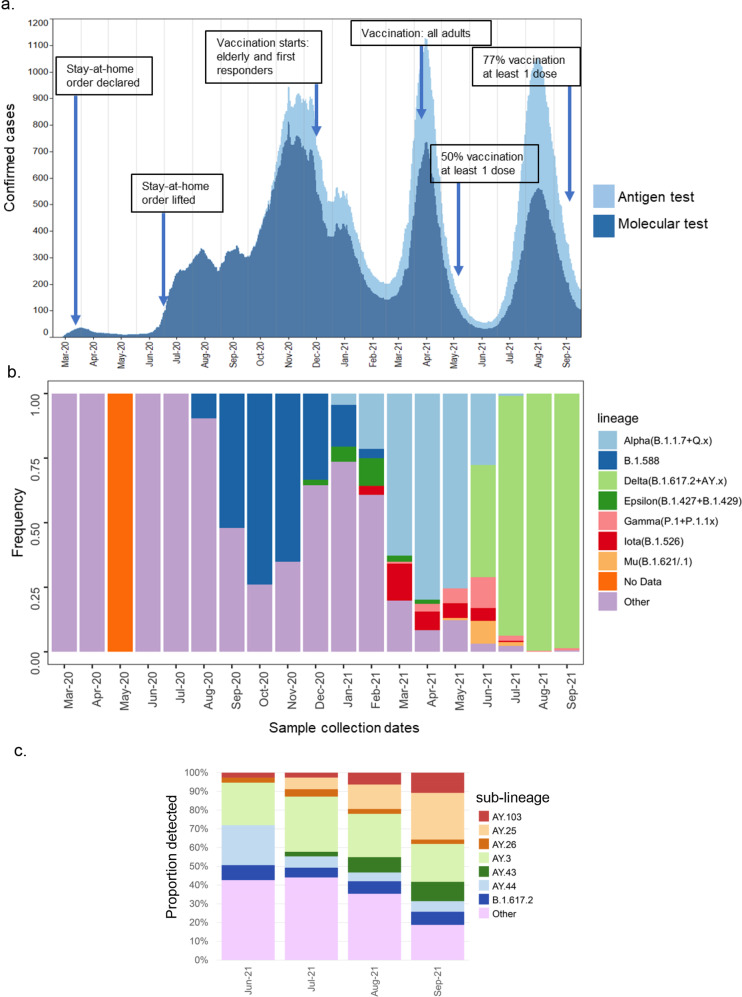
Fig. 1. Epidemiology and dynamics of SARS-CoV-2 lineage turn-over in Puerto Rico.
a Graphical representation of the number of daily SARS-CoV-2 cases confirmed by antigen tests (light blue) and molecular tests (dark blue) reported by the PRDH from March 2020 to September 30th, 2021, shown as a 21-day rolling average. Arrows indicate the timeline of government responses and vaccination milestones. b Proportion of all SARS-CoV-2 lineages and emerging variants detected in Puerto Rico and published in GISAID from March 2020 to September 30th, 2021 (n = 2514 sequences after filtering for high-coverage genomes with complete sampling dates). Non-VBM/VOC lineages (n > 63) are categorized as a collective labeled “Other”, except for local lineage B.1.588 due to high frequency and focus of this study. No genomes were obtained during May 2020. c Proportion of all Delta sub-lineages detected in Puerto Rico published in GISAID until September 30th, 2021 (n = 1360 genomes). Sub-lineages with more than 5% detection are represented by individual color, whereas sub-lineages with <5% detection are categorized as a collective labeled “Other”.

