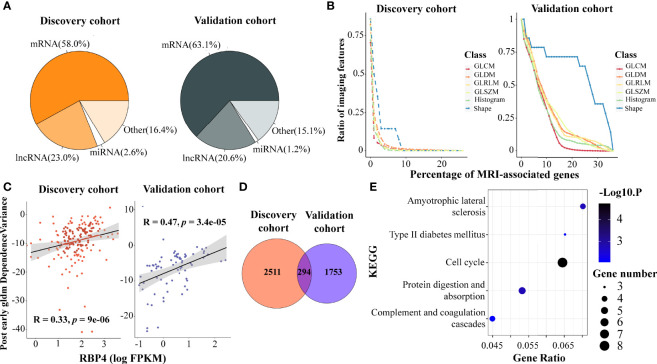
Figure 1.
Association analysis of DCE-MRI features and BC transcriptomic characteristics. DCE-MRI features associated with molecules including mRNAs and non-coding RNAs in both cohorts (A). Tumor shape features showed broader association with gene expression than other features. x-Axis represents the percentage of the number of genes, and y-axis denotes the percentage of the number of imaging features related to genes to the total number of features in this feature class. The point on the lower right corner of the curve means that there are fewer proportions of imaging features associated with more genes (B). The expression of RAP4 was associated with the same imaging feature. x-Axis represents the log2-transformed value of FPKM gene expression, and y-axis denotes the imaging feature value (C). A total of 294 MRI-associated genes overlapped in the two cohorts (D), and five KEGG pathways including cell cycle were enriched in these overlapped genes (E). DCE, dynamic contrast enhanced; BC, breast cancer; FPKM, fragments per kilobase of exon per million reads mapped; KEGG, Kyoto Encyclopedia of Genes and Genomes.

