Figure 6.
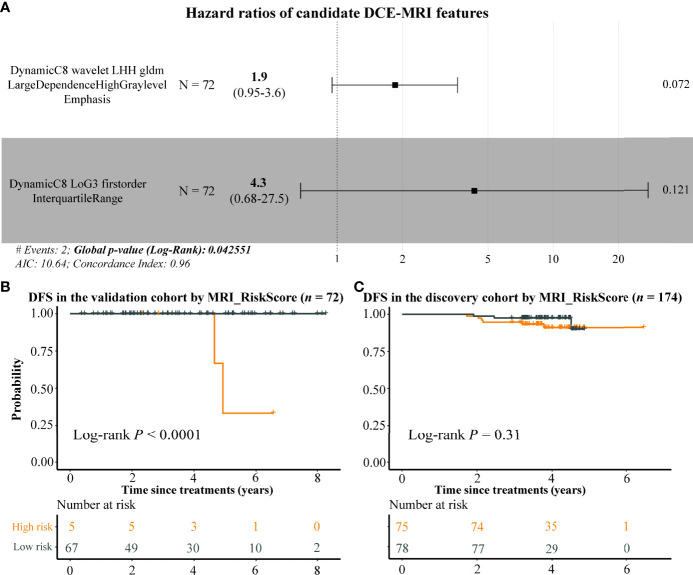
The potential prognostic ability of DCE-MRI features. Forest plot by using multivariate Cox regression analysis indicates that BIF3 and BIF4 were risk factors of BC (A), and the Kaplan–Meier plots display the DFS differences between high and low MRI risk score BC samples in the validation and discovery cohorts (B, C). DCE, dynamic contrast enhanced; BC, breast cancer; DFS, disease-free survival.

