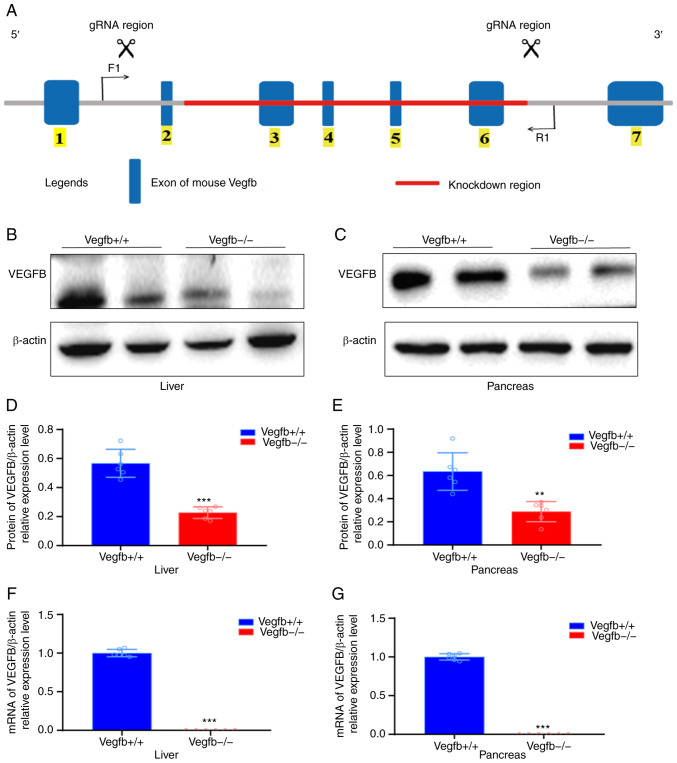
Figure 1.
Systemic VEGFB-knockdown mouse model construction and genetic identification. (A) VEGFB gene structure, gRNA target site and deletion region. Boxes and lines respectively represent exons and introns. F1 and R1 arrows indicate the position of primers for PCR genotyping. 1–7 shows the VEGFB gene sequence, where the red line represents the VEGFB knockout gene sequence. (B-E) Western blot analysis of VEGFB protein in liver tissues and pancreas. (F and G) mRNA analysis in the liver tissues and pancreas. **P<0.01 vs. VEGFB+/+ group and ***P<0.001 vs. VEGFB+/+ group. VEGFB, vascular endothelial growth factor B.

