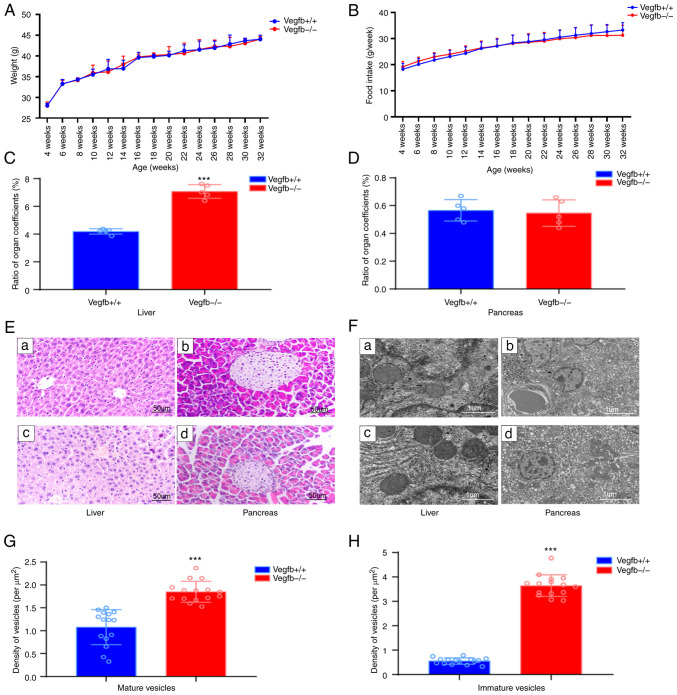
Figure 2.
Effect of VEGFB downregulation on liver and pancreas. (A) Body weight curve of mice (4–32 weeks). (B) Food intake curve of mice (4–32 weeks) (C and D) Organ coefficient ratio between liver and pancreas in mice. (E) Light microscopic structure of liver and pancreas; a and b: VEGFB+/+ group, c and d: VEGFB-/- group (scale bar, 50 µm; magnification, ×400). (F) Electron microscopic structure of liver and pancreas; a and b: VEGFB+/+ group, c and d: VEGFB-/- group (scale bar, 1 µm; images a and c, ×15,000 magnification; images b and d, ×8,000 magnification). (G and H) Density of mature and immature vesicles. ***P<0.001 vs. VEGFB+/+ group. VEGFB, vascular endothelial growth factor B.

