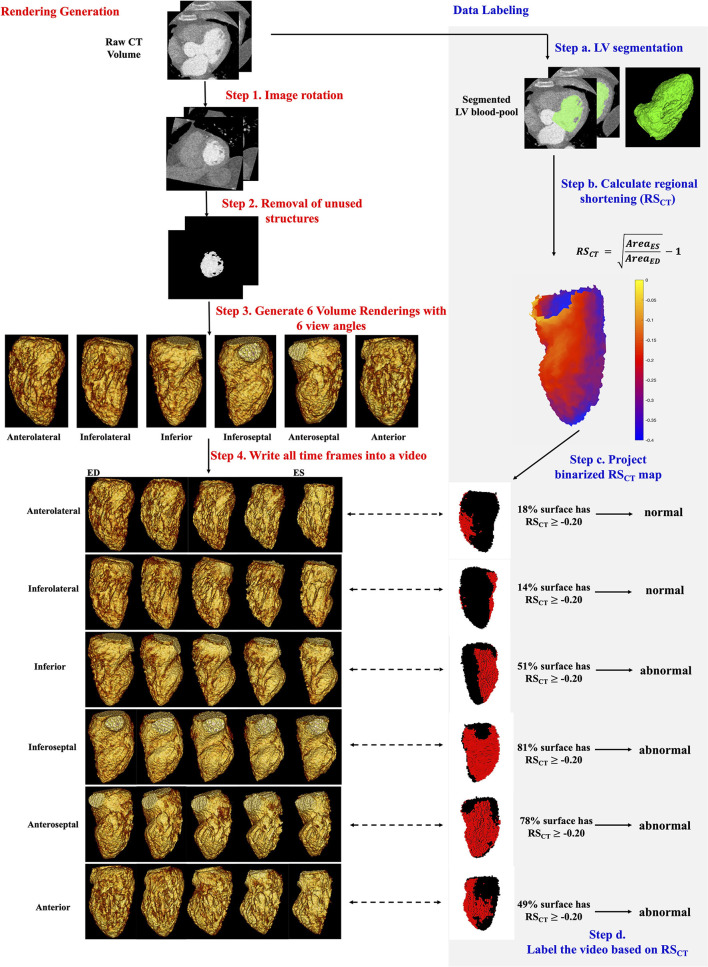
Figure 1.
Automatic generation and quantitative labeling of volume rendering video. This figure contains two parts: Rendering Generation: automatic generation of VR video (left column, white background, step 1-4 in red) and Data Labeling: quantitative labeling of the video (right column, light gray background, step a-d in blue). Rendering Generation: Step 1 and 2: Prepare the greyscale image of LV blood-pool with all other structures removed. Step 3: For each study, 6 volume renderings with 6 view angles rotated every 60 degrees around the long axis were generated. The mid-cavity AHA segment in the foreground was noted under each view. Step 4: For each view angle, a volume rendering video was created to show the wall motion across one heartbeat. Five systolic frames in VR video were presented. ED, end-diastole; ES, end-systole. Data Labeling: Step a: LV segmentation. LV, green. Step b: Quantitative RSCT was calculated for each voxel. Step c: The voxel-wise RSCT map was binarized and projected onto the pixels in the VR video. See Supplementary Material 2 for more details. In rendered RSCT map, the pixels with RSCT ≥−0.20 (abnormal wall motion) were labeled as red and those with RSCT < −0.20 (normal) were labeled as black. Step d: a video was labeled as abnormal if >35% endocardial surface has RSCT ≥−0.20 (red pixels).

