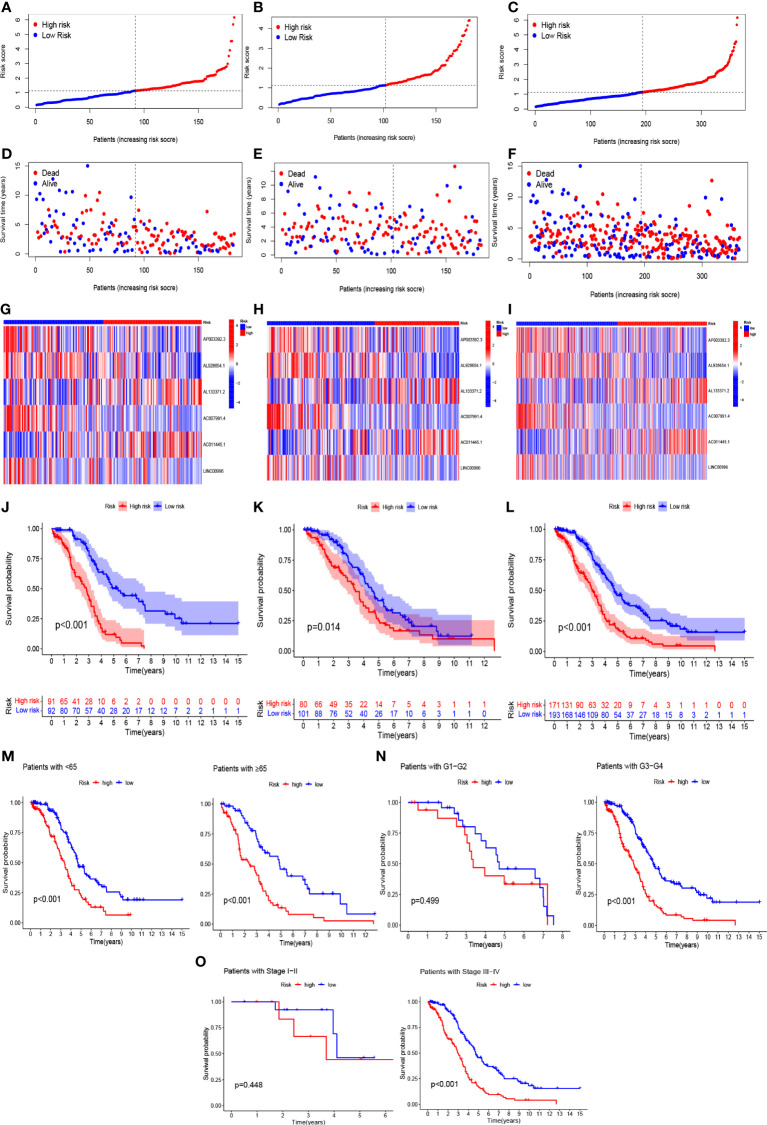
Figure 4.
In the train, test, and entire sets, the prognostic value of the model for six necroptosis-associated lncRNAs. (A–C) A model of necroptosis-associated lncRNAs according to risk score of the train, test, and entire sets is displayed, respectively. (D–F) Surviving time and survival status among low- and high-risk groups in the train, test, and overall sets. (G–I) The heat maps of 6 lncRNAs expression can be seen in the train, test, and overall set. (J–L) Overall survival of OC patients in the train, test, and entire sets between low- and high-risk groups, respectively (M–O) Survival curves of Kaplan–Meier of OS prognostic value based on age, grade, and stage between low- and high-risk groups in the entire set.

