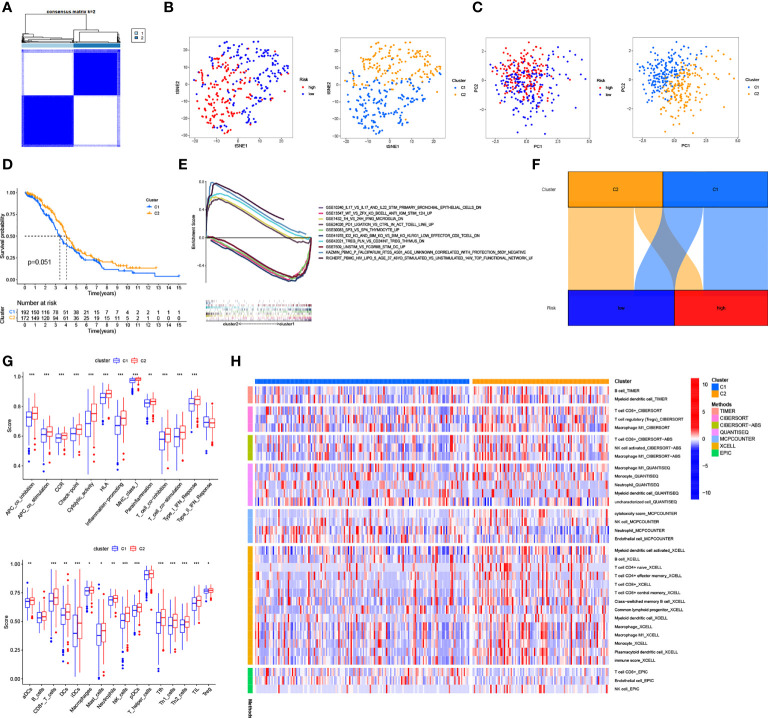
Figure 8.
Cold and Hot Tumor Cluster Screening. (A) According to ConsensusClusterPlus, OC patients are split into two clusters. (B) Risk groups and clusters of T-SNE. (C) The PCA for risk groups and clusters. (D) Survival curves of Kaplan–Meier for OS in clusters. (E) The GSEA of immunologic signature in clusters. (F) The Sankey diagram of risk groups and clusters. (G) The ssGSEA scores in clusters. (H) The heat map shows immune cells grouped in clusters. *: p < 0.05. **: p < 0.01. ***: p < 0.0001.

