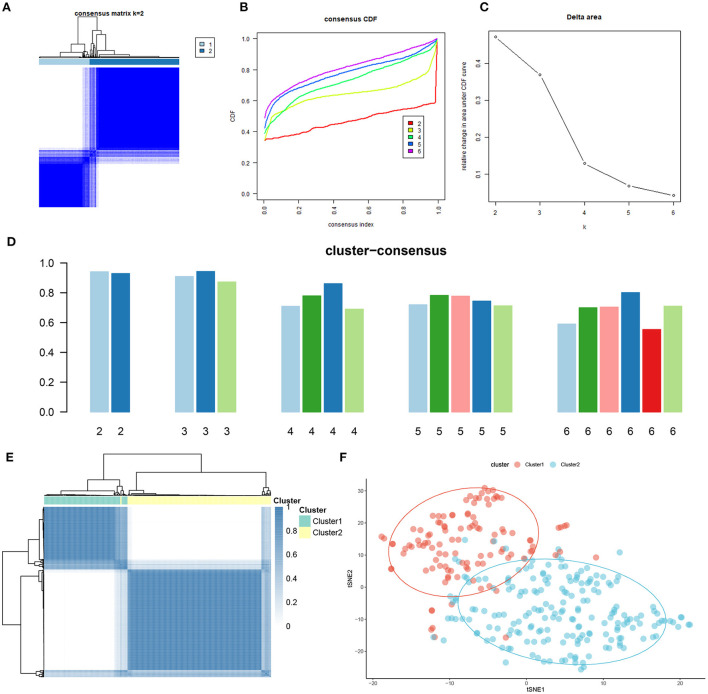
Figure 3.
Identification of cuproptosis-related molecular clusters in AD. (A) Consensus clustering matrix when k = 2. (B–E) Representative cumulative distribution function (CDF) curves (B), CDF delta area curves (C), the score of consensus clustering (D), and heatmap of non-negative matrix (E). (F) t-SNE visualizes the distribution of two subtypes.

