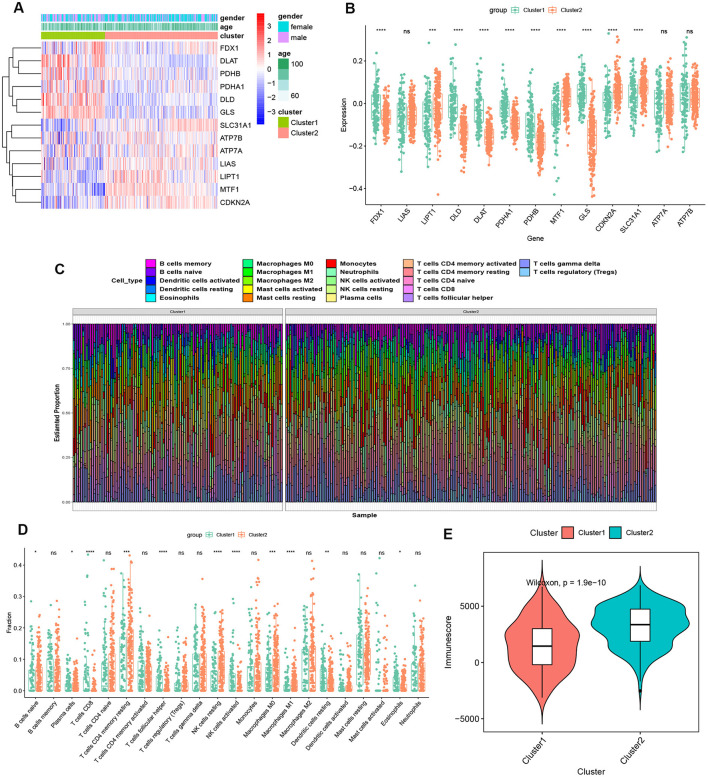
Figure 4.
Identification of molecular and immune characteristics between the two cuproptosis clusters. (A) Clinical features and expression patterns of 13 CRGs between two cuproptosis clusters were presented in the heatmap. (B) Boxplots showed the expression of 13 CRGs between two cuproptosis clusters. ***p < 0.001, ****p < 0.0001, ns, no significance. (C) the relative abundances of 22 infiltrated immune cells between two cuproptosis clusters. (D) Boxplots showed the differences in immune infiltrating between two cuproptosis clusters. *p < 0.05, **p < 0.01 ***p < 0.001, ****p < 0.0001, ns, no significance. (E) Boxplots showed the estimated immune score between the two cuproptosis subtypes.

