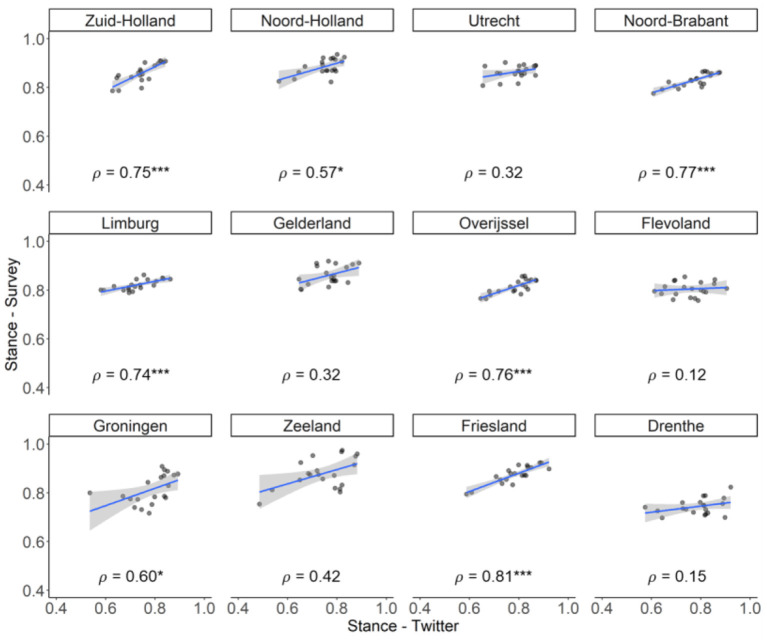
Figure 4.
Scatterplots showing the correlations between stance estimated from Twitter and survey data for the Dutch provinces. Provinces are ordered from left to right and top to bottom based on their population density. The x- and y-axes are restricted to [0.4, 1] in order to show the temporal changes more clearly. Significance indicator: P < 0.05*, P < 0.001***.

