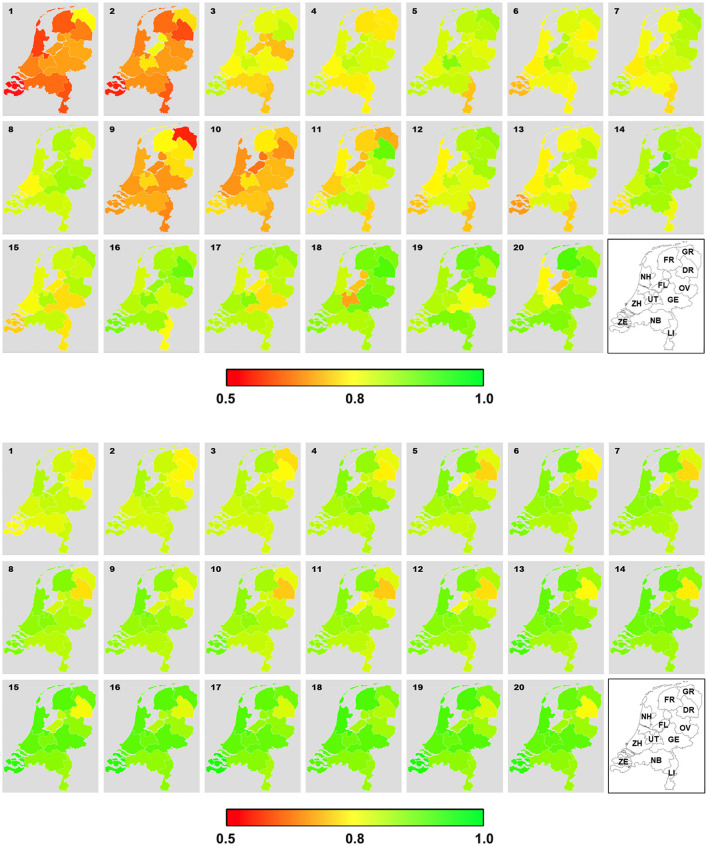
Figure 6.
Geographical variation of stance on social distancing over the 20 weeks estimated from Twitter data (top) and survey data (bottom). ZH, Zuid-Holland; NH, Noord-Holland; UT, Utrecht; NB, Noord-Brabant; LI, Limburg; GE, Gelderland; FL, Flevoland; OV, Overijssel; GR, Groningen; ZE, Zeeland, FR, Friesland; DR, Drenthe. Redder and greener colors represent stance between 0.5 and 1.

