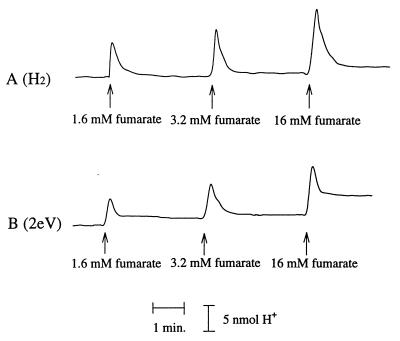
FIG. 3.
Proton translocation after addition of fumarate to a cell suspension of A. succinogenes. (A) Cells preincubated with H2; (B) cells preincubated in ECB system with electrically reduced NR. The cells (OD660, 10.0; 5.696 mg of protein/ml) were placed in KKG solution at room temperature. The x axis represents time (in minutes), and the y axis represents proton concentration (in nanomoles).

