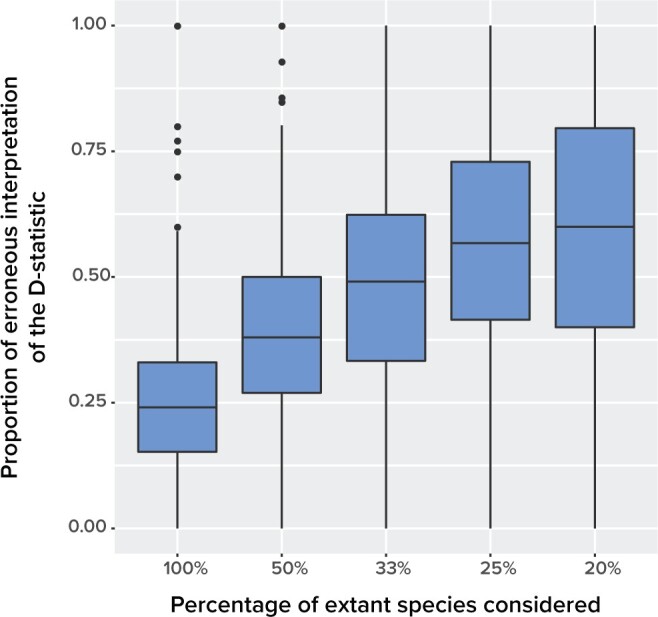
Figure 4.

The effect of taxonomic sampling ( -axis) on the proportion of erroneous interpretations of the D-statistic (
 -axis). The error rate is increasing with the amount of unknown.

The effect of taxonomic sampling ( -axis) on the proportion of erroneous interpretations of the D-statistic (
 -axis). The error rate is increasing with the amount of unknown.