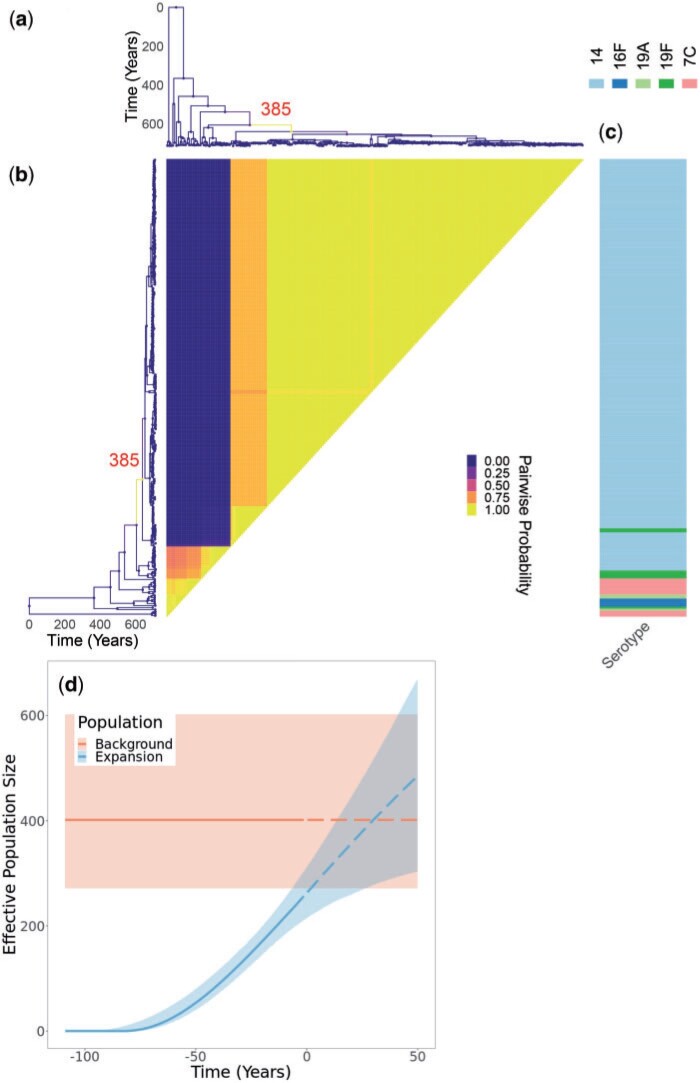
Figure 5.
Application to GPSC18 Streptococcus pneumoniae phylogeny. a) Dated phylogeny with branches colored according to the inferred probability of clonal expansion. The single branch with a high probability of clonal expansion is labeled. b) Pairwise matrix showing the posterior probabilities of any two samples belonging to the same subpopulation. c) color map showing serotype values. d) Posterior summary of the inferred effective population size functions. The colored regions represent 95% credible interval and the lines represent median. Solid denotes past effective population size inference and dashed represents prediction of future effective population size.

