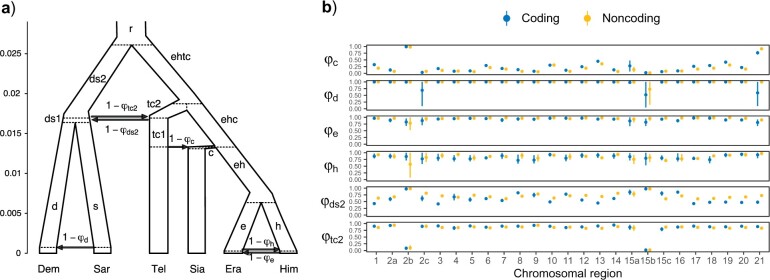
Figure 4.
a) The introgression (MSci) model, proposed based on the bpp species tree estimation under MSC and 3s analysis under the IM model, involving two unidirectional introgression events (s  d with introgression probability
  , and tc1
  c with probability
  and two BDI events (e
  h with probabilities
  and
and  , and ds2
  tc2 with probabilities
  and
and  . The model involves 34 parameters: 5 species divergence times and 4 introgression times (
 ), 19 population sizes (
 ), and 6 introgression probabilities. To identify parameters (see Fig. S4 of the Supplementary material available on Dryad), internal nodes are labeled with lowercase letters, for example, e is the parent node of Era, eh is the parent node of e and h, etc. Each branch corresponds to a population and is referred to using the label for its daughter node, for example, branch e-Era is labeled branch Era and has population size
  , and branch eh-e is labeled branch e and has
  . Branch lengths in the tree represent posterior means of divergence/introgression times in the bpp analysis of the 6,030 noncoding loci in chromosome 1. Estimates for other chromosomes or for coding loci are presented in Figure 5. b) Posterior means (dots) and 95
 HPD intervals (bars) of the six introgression probabilities (
 ) under the MSci model of (a) obtained from bpp analysis of the 25 chromosomal regions (see Figure 5 for the number of loci). Estimates for other parameters are in Figure S4 of the Supplementary material available on Dryad. Inversion regions 2b and 15b on chromosomes 2 and 15 were analyzed separately, and there was an alternative set of posterior estimates resulting from within-model unidentifiability; see Figure 6.

