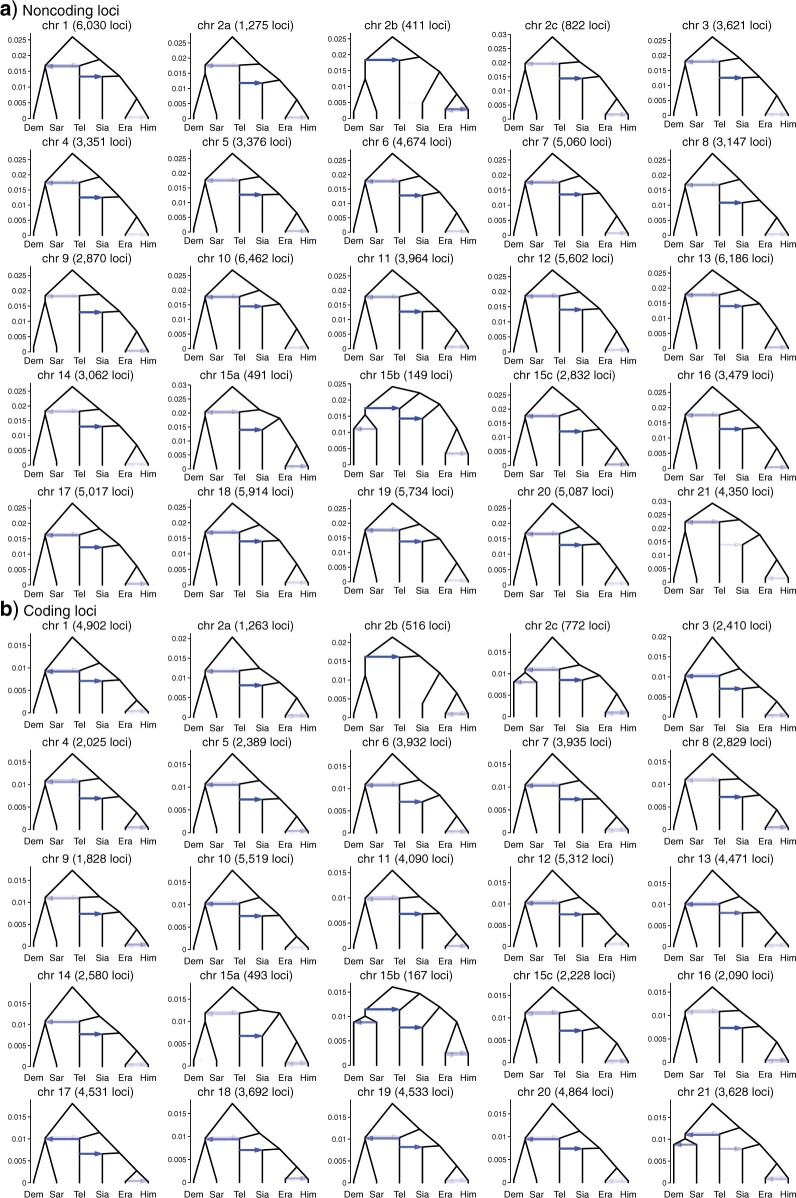
Figure 5.
Estimated introgression history in each chromosomal region obtained from bpp analysis under the MSci model (Fig. 4a) using a) noncoding and b) coding loci. Intensity of the horizontal edges represents the posterior means of the six introgression probabilities (see Fig. 4b), while the y-axis represents the nine divergence/introgression times in the expected number of mutations per site. A full list of posterior estimates and 95 HPD intervals, including 19 population size parameters, is in Table S9 of the Supplementary material available on Dryad.

