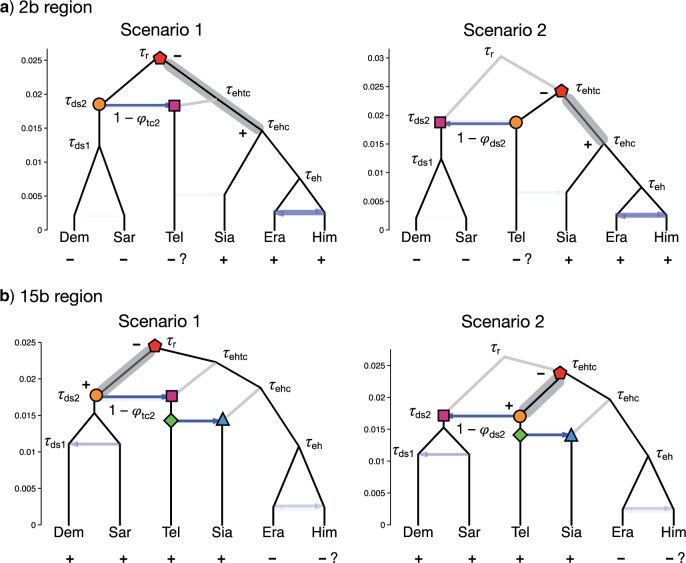
Figure 6.
Within-model unidentifiability and possible introgression histories for inversion regions a) 2b and b) 15b, showing estimated divergence times from bpp analysis under the MSci model (Fig. 4a). For each region, there are two competing scenarios of the introgression history that fit the data equally well, resulting in unidentifiability of certain model parameters. Plus ( ) represents the derived inverted orientation while minus (–) is the ancestral noninverted orientation. Species with uncertain inversion orientation are marked with `?’. Node symbols and colors indicate matching nodes and times between the two scenarios. The estimates were based on posterior means from noncoding loci. Gray band indicates an ancestral population within which the derived inverted orientation (
 ) may have arisen from the noninverted orientation (–). Note that parameters associated with nodes reached by very few sequences (indicated as gray branches) were expected to be poorly estimated, with a wide posterior interval. For example, in Scenario 1 for 2b,
  , and
, and  were poorly estimated (Fig. S4 of the Supplementary material available on Dryad and Table S9 of the Supplementary material available on Dryad).

