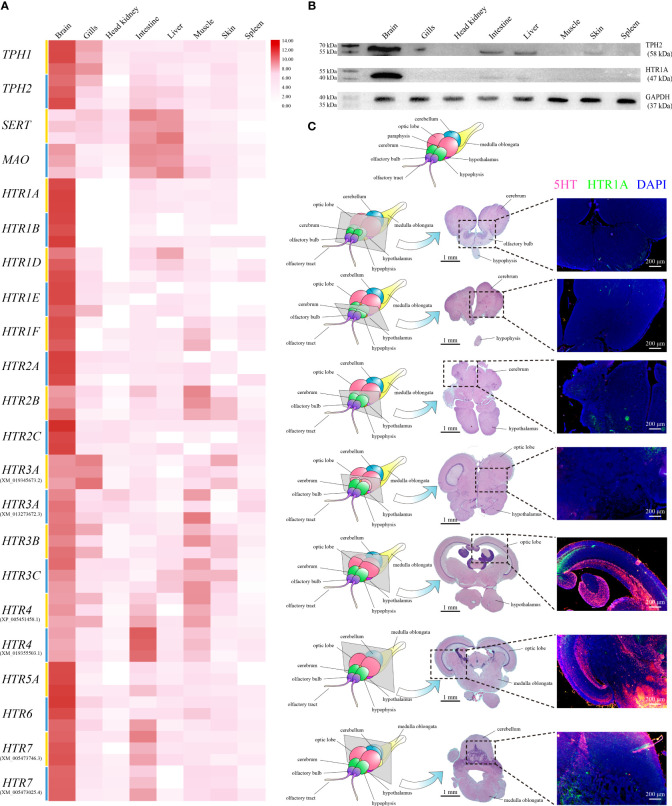
Figure 2.
(A) Relative expression levels of On-TPH1, On-TPH2, On-SERT, On-MAO, and On-HTRs mRNA among different tissues in healthy Nile tilapia, assessed via qRT-PCR. n = 3. Expression level of each gene in the brain was set as 1000. (B) Western blot analysis of On-HTR1A and On-TPH2 in different tissues of healthy Nile tilapia. GAPDH was applied as a reference protein. See Figure S2 for the complete figures. (C) Location of 5-HT and On-HTR1A in the Nile tilapia brain. Top, diagram of Nile tilapia brain morphology. Left column, diagram of sections with typical brain structures in healthy Nile tilapia. Midcolumn, H&E of each selected section. Right column, On-HTR1A (green), 5-HT (red), and nucleus (blue) of each section determined via immunofluorescence (IF).

