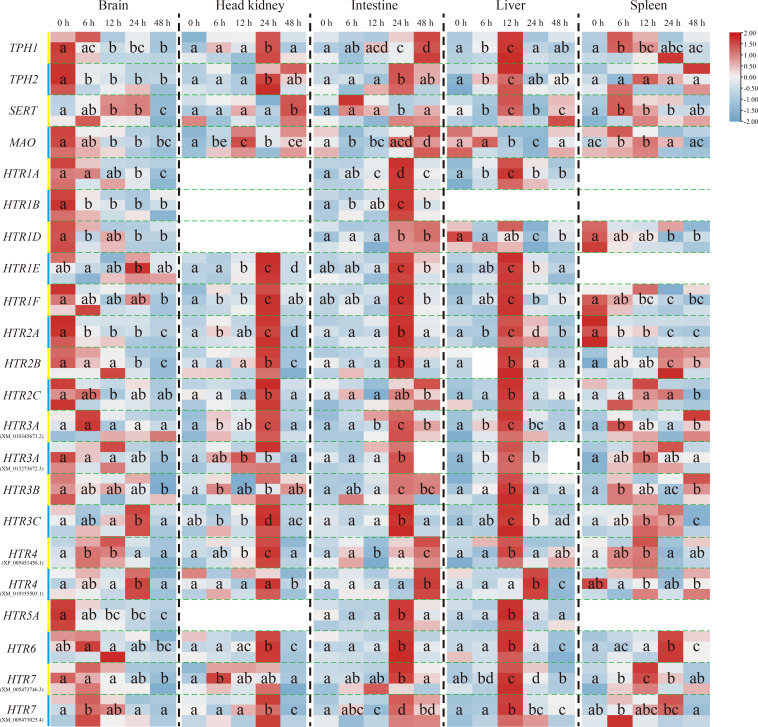
Figure 3.
Expression patterns of On-TPH1, On-TPH2, On-SERT, On-MAO, and On-HTRs mRNA among different tissues (the brain, head kidney, intestine, liver, and spleen) at a series of time points after S. agalactiae injection, as detected via qRT-PCR. The expression level of these genes at 0 h is set as 1.00 to calculate the relative expression of the other time points. n = 3. The significant difference analysis was using post hoc tests (Tukey HSD test) with one-way ANOVA and the different letters indicated significant difference (p < 0.05).

