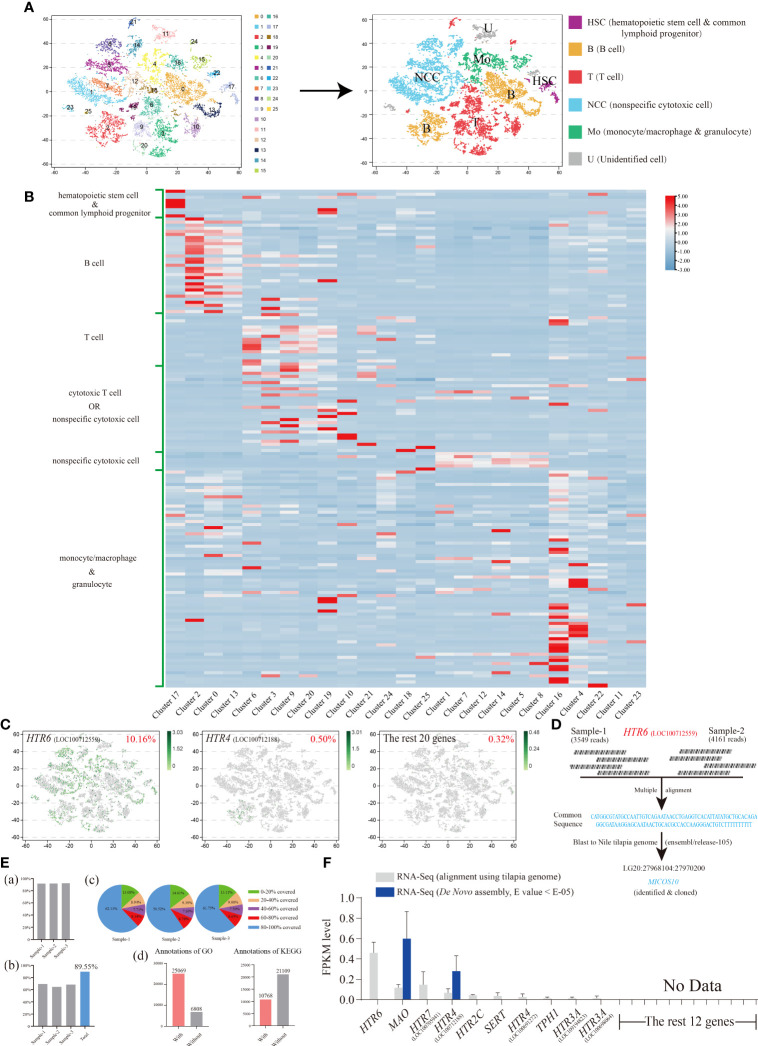
Figure 4.
(A) The visualization of Nile tilapia HKL population via tSNE nonlinear clustering. Left, original classification of Nile tilapia HKL population. Right, identification of six cell subpopulations based on marker genes. (B) Heat map of the expression of different types of cell marker genes among each cluster. See Table S3 for the details of marker genes. (C) The tSNE results of the top two genes, HTR6 and HTR4, as well as the remaining 20 genes. The number at the top right of the figure indicates the proportion of positive cells. Each dot in the figure represents a cell. See Table S4 for the details of marker genes. (D) Diagram of analysis process of HTR6 sequence from scRNA-Seq. (E) Basic information of Nile tilapia HKL RNA-Seq aligned via reference genome. Proportion of genes mapped to the reference genome (A). Proportion of reference genome genes sequenced in three samples and their union (B). Distribution of genes’ coverage of each sample (C). Number of unigenes annotated via GO and KEGG (D). (F) Expression level of On-TPH1, On-TPH2, On-SERT, On-MAO, and On-HTRs in Nile tilapia HKL RNA-Seq aligned via reference genome or de novo assembled. See Table S5 for the expression details of candidate genes.

