. 2022 Jul 28;13:921668. doi: 10.3389/fpls.2022.921668
Copyright © 2022 Ali, Hafeez, Ahmad, Javed, Sumaira, Afridi, Dawoud, Almaary, Muresan, Marc, Alkhalifah and Selim.
This is an open-access article distributed under the terms of the Creative Commons Attribution License (CC BY). The use, distribution or reproduction in other forums is permitted, provided the original author(s) and the copyright owner(s) are credited and that the original publication in this journal is cited, in accordance with accepted academic practice. No use, distribution or reproduction is permitted which does not comply with these terms.
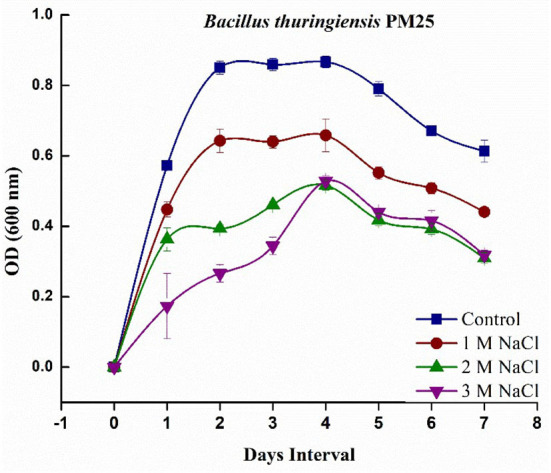
Figure 1.

Growth curve analysis of Bacillus thuringiensis PM25 under salinity stress (0, 1, 2, and 3 M NaCl).
